Belitsoft > Power BI Inventory Management to Prevent Over- and Understocking

Power BI Inventory Management to Prevent Over- and Understocking

Client

Our client is one of the largest retail suppliers who is tracking millions of records across multiple retail stores in different cities and would like to know how to walk the fine line between over- and understocking. Custom inventory intelligence is the solution.

Challenge

Having the right product at the right store at the right time is critical. Late or inaccurate inventory information led to higher carrying costs, write-offs, and missed sales opportunities.

In some retail stores, there is a demand for certain goods while they are not available to purchase because of out of stock - managers ordered too few of them. The first goal is to quickly and easily see which goods are out of stock and act fast so they don’t lose any sales.

Other retail stores carry too much inventory for different reasons. The second goal is to proactively identify overstocks ahead of time and reduce them using recommendations on inventory store-to-store transfers to meet demand in other locations.

As a rule, retail outlets are managed by independent (stand-alone) inventory management tools and connected to local retail store databases.

It's next to impossible for inventory managers of the head office to consolidate, aggregate, calculate and visualize the data from these databases in real-time.

Inventory managers need analytics software to help them answer the following questions:

  • What are our customers buying weekly and monthly throughout our retail network?
  • Will we have enough stock? Which warehouses hold what quantities of inventory? Which products are likely to need re-stocking or a transfer.
  • See details for the current stock on hold, and how old the inventory is (aging report) by product. Do we need to discount stock to get rid of inventory based on poor sales we are experiencing?

Process

After gathering the technical and business requirements, we have created a specification describing the dimensions and metrics.

For example, we’ve selected a number of dimensions like “Organization” to mirror the structure of the company, “Product” to represent the product lines that the company sells, “Period and Business Calendar” and so on.

To implement the BI solutions we have deployed a Microsoft SQL Server. Using Microsoft SQL Server Management Studio we’ve created a central Data Warehouse (DWH) on this server.

  • We have developed custom connectors that automatically import data from the local retail store databases (OLTP databases) to the staging database of DWH.
  • We have tuned the transformation procedures for the raw data to adapt it to the DWH requirements.
  • We have tuned the procedures of data transfer from the staging database of the DWH to a multi-dimensional Production database (OLAP cube).

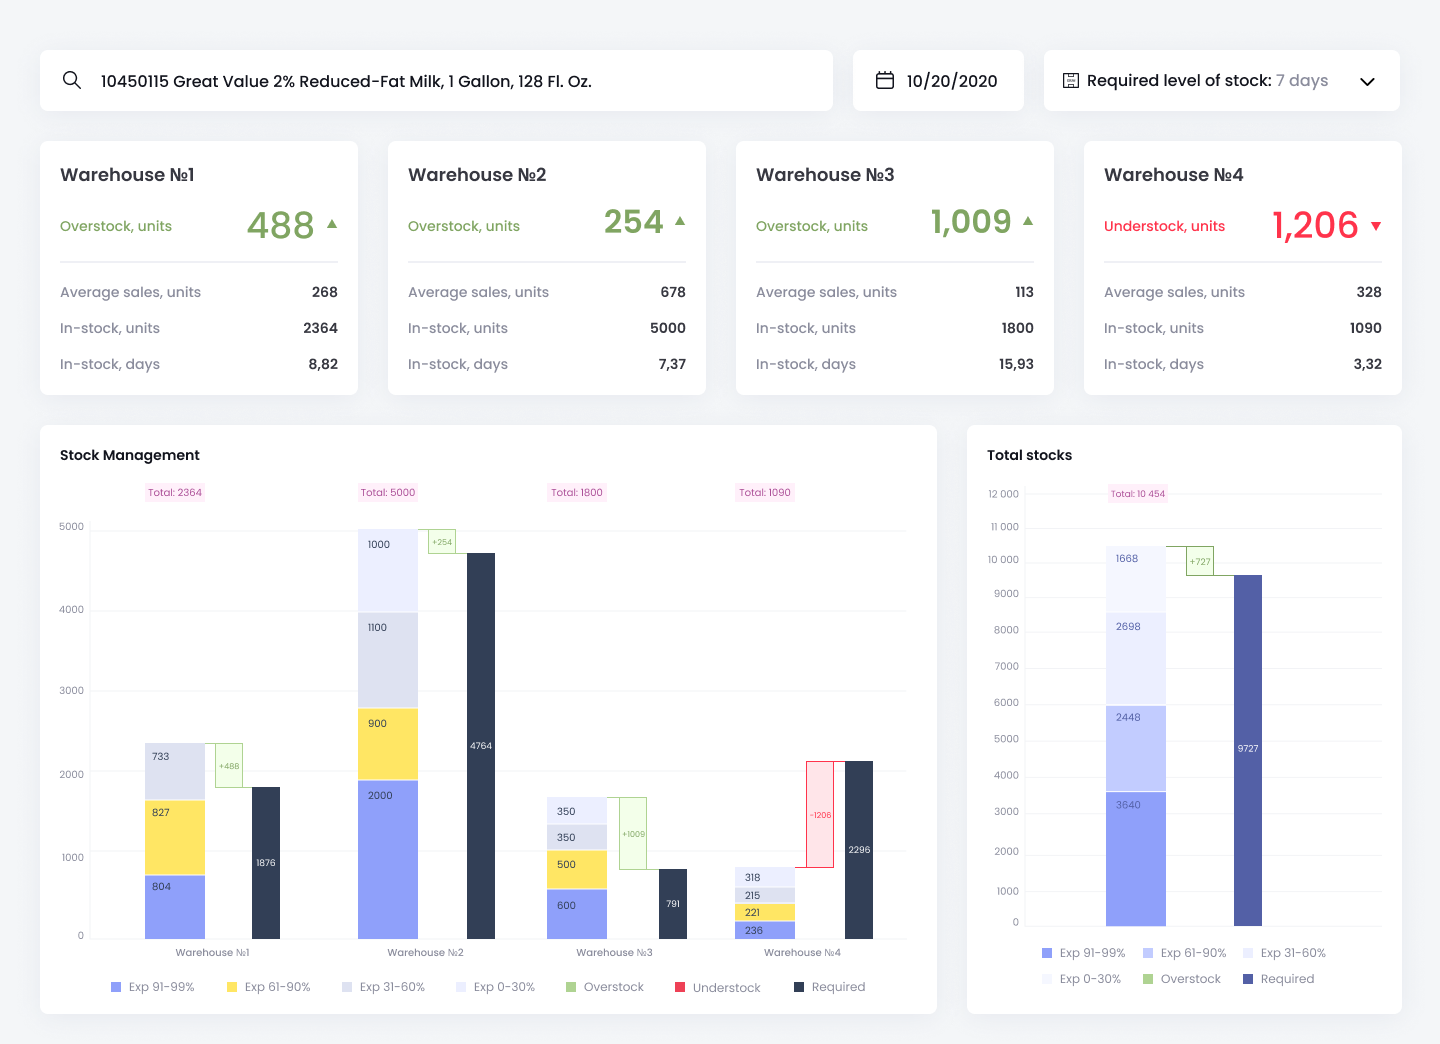
Based on the data from OLAP cube in POWER BI we have visualized data as dashboards that help the inventory managers answer the above mentioned questions.

We have also set up different access rights for different user categories (each has access to their job-specific metrics).

Results

We have prepared standardized dashboards.

The inventory manager simply presses the 'refresh' button to generate the required report, gaining a comprehensive overview instantly.

In the morning, an analyst might notice low inventory turnover or insufficient stock for a specific SKU in a particular shop. Using this data, the inventory manager can promptly recommend redistributing surplus goods to the shops in need.

In addition, we have implemented an automatic system to order and redistribute the remaining goods. The BI enabled the creation of a specification document for customizing the company's accounting software. The data is taken from the DWH: if the SKU remainder is above or below the optimum level in different retail shops, a transfer request will be made.

Three months after the implementation of this BI solution the company has seen the following improvements:

  • The average monthly active inventory improved by 7,5%, which increased company revenue.
  • The inventory turnover improved by 2,5%, which allowed to improve the gross margin return on investment (GMROI).
1

Related cases

Related cases
Hotel Business Intelligence
Our client is a startup owner who came to us with the idea to develop a new Business Intelligence System for hotels. He needed more than just senior-level experts who are able to choose the right architecture of the new system - he needed a team that could deliver enterprise-level analytical products.

Recommended posts

Belitsoft Blog for Entrepreneurs
Business Intelligence Implementation
We transform your big data into rich data: dashboards and reports (Excel, Power BI, Web, etc) that are easy to use for making management decisions and get them working for your business. Our prebuilt reporting tools (for the C-Level, Sales Intelligence, Customer Intelligence, Marketing Intelligence, Financial Business intelligence, Supply Chain Intelligence, HR Business Intelligence, and other) let us speed up BI implementation. Talk to our BI implementation consultants BI Project Implementation Steps 1. BI Requirements Gathering, Resource and Funding Plan Do you have a detailed specification document for your new BI system?  This document will let you conduct a step-by-step check of your finished BI solution to see whether it conforms to your wishes at the beginning of the project. Besides, this is the only basis for understanding what your Resource and Funding Plan should be.   Which questions should the specification document answer?  Which employees would use the system? Which business processes that you need to digitize are they responsible for?  Which KPIs and metrics do you need to track in your BI reporting system?  If you don't have a detailed specification document for your new BI system we will provide you with a BI Business Analyst, who may work independently or in tandem with a BI consultant for healthcare or fintech, depending on your domain. These specialists understand the specific regulatory, operational, and performance nuances of your industry and will prepare such specification document for your needs. Our analyst maps out the business processes of your enterprise: He describes the connections between the business processes.  The document lists all the enterprise's functions and key stakeholders responsible for each of them, as well as KPIs and other measures for all the functions.  The resulting map becomes a foundation for the specification, as well as the framework for the future BI system, allowing the correct role-based access model to be developed (which employees will have access to what information) and letting the executives see the relations between the business-critical parameters. The specification is used as a foundation for a Resource and Funding Plan. It will show you:  Implementation steps; Implementation timeline; Implementation costs (human resource involvement on both your and our sides, and project budget). Tell us which core business processes do you need to control and we will provide you with an optimal set of well established KPIs specific to your business. 2. Design and Build a Data Warehouse for Business Intelligence Implementation We have started to implement your BI project.  The purpose of this step is to integrate different sources of your data (Databases, Flat Files, Marketing Analytics, Social Media, CRM/ERP, Helpdesks, etc.) into a single unified source - a so-called “Data Warehouse” database or set of databases.  Let us know which data sources do you need integrated with your BI solution?  Data Warehouse Implementation Steps 1. Developing the data storage structure of the Data Warehouse: which table to use for which kind of data (physical data structure). 2. Developing scripts for each data source to: a) Extract data from them; b) Check data for duplication and other errors, transform the data to fit the technical requirements of the Data Warehouse; c) Load the processed data in the Data Warehouse;  This step is called “ETL processes configuration” (ETL stands for “extract”, “transform” and “load”). 3. Tuning the Data Warehouse to conduct complex calculations - do the so-called “Data Enrichment configuration”. Why do you need this? a) If you need to add value to your existing data by using ABC(XYZ)-analysis, ranging, categorization, forecasting, modeling, etc., you need resource-intensive calculations.  b) You probably know what it’s like to see Excel freeze or stop working. One of the causes of these issues is trying to use Excel for calculating complex metrics, not just to visualize data. Using large amounts of data or complex formulas exacerbates this problem.   According to the best practices in BI development, complex data, including KPIs, should be calculated at the database level (backend) not the visualization tool level (frontend). This will ensure your business reports work quickly and reliably.  4. Connecting Data Warehouse database with OLAP Cube database.  Forming reports for your specialists based on the data stored in the Data Warehouse requires a dedicated developer manually writing database requests. This is, of course, unacceptable for a modern business, so you need to use one more technology - an OLAP Cube database.  For example, you need to create a multidimensional report. Your Data Warehouse has three tables: sales by date, sales by locations, sales by products.  To get a report about the amount of a certain product sold at a certain shop at a certain date the developer needs to write two requests to the Data Warehouse: about the sales on a certain date and about sales at a certain shop. And another request to consolidate the data. This looks inconvenient even at such a simple example. Yet after the OLAP Cube is prepared you don’t need a programmer for making multidimensional reports. Getting one only takes a standard Excel request. The OLAP Cube will do the heavy lifting, as it will have the necessary data and each sale would have the necessary dimensions (“date”, “shop”, “product”).  3. BI Data Visualization The previous steps let us creating the databases and making sure the data is correct. Now we need to work on the Dashboards, Scorecards, and Reports. This step brings you the interfaces that will be used by you or your employees daily. There are three kinds of interfaces: Dashboards with graphs, Scorecards, and Spreadsheet Reports  Dashboards The purpose of the dashboards is to show (even in real-time) the current state of the most important high-level metrics (both for specific processes and the business as a whole), the total indicators. Usually you can’t trace the cause-and-effect relationships here, but that isn’t the goal anyway. Graphs are often present.   Scorecards Scorecards - are a type of dashboards. The difference lies in their purpose. Scorecards demonstrate how the KPIs are being fulfilled (comparison with the planned results and showing deviations). This can be done for separate processes and the business as a whole.   Reports The reports are made to establish the cause-and-effect relationships and a structure within a specific process (the data is later summarised and used for dashboards).  The reports can be pre configured or easily and conveniently adapted by the users themselves without involving analysts, data scientists or IT specialists (self-service multidimensional reports).  4. BI Deployment  You can see the whole picture only after all the previous steps have been completed. Now you know that everything (both calculations and visualizations) works quickly enough (done within a few seconds) and don’t overstrain servers and user computers (so you don’t have to purchase any additional expensive equipment). This is also the time to decide on the optimal periodicity to automatically refresh your dashboards and reports. For example, IOT data needs to be updated in real-time (which leads to higher hardware requirements), but there is no reason to update the ABC-analysis data more often than once a month. 5. BI Security configuration  1. You would probably like to delineate the information access rights for the employees in different positions (e.g. they don’t need to know their co-workers’ salaries unless it is required as part of their duties). We prepare the role-based security that guarantees you flexible control (ease of adding/deleting new users and assigning rights).   2. We sign an NDA with you, providing you with legal protection of your data used over the course of the BI solution development and implementation.   6. BI Training We conduct a brief intensive training on tuning and using the system for different kinds of your users, including data engineers, business analysts, and business users.
Dmitry Baraishuk • 5 min read
Benefits of a Data Warehouse: What You Could Lose Without a DWH?
Talk to our data warehouse consultants Benefits of a Data Warehouse over a Database You are using a Database (DB) during your daily activities for entering, storing and modification transactional (that is, statistical) business data. For example, the database of your accounting software or CRM software etc. Database contains detailed information about what you sold to whom and when: the Сustomer #1 from Segment #1 bought three units of the SKU#1 on the 10th of March 2020).  There can be tens of thousands of such entries per day. So you can’t use these data as a basis for decision making without initial preparation. To prepare the data for analysis, you have to: download the data from the DB (the source database); upload it to the special software (e.g. Excel, Power BI, Tableau, etc.); make your calculations. The more calculations you need to do, the more time they take, and the higher the chances of making a mistake are. Only after this, the data can be used for decision making. Data Warehouse A Data Warehouse (DWH), as usual, is a set of databases. A data warehouse stores both statistical and aggregated data. A DWH is created primarily to analyze data for decision making.  A DWH database could be the source of the following aggregated and calculated data: Total Sales (by Location, Category, SKU, Period, and more). For example, all Сustomers from Segment #1 bought 100 000 units of goods from Category #1 brought $1,000,000 in March 2020; Total Sales Growth (by Location, Category, SKU, and more). For example, it increased by 100,000$ or 10% in March 2020 compared with March 2019.  Budget Vs. Actual (by Location, Category, Period, Сustomer Segment, and more). For example, the actual variance is $10,000 or -10%.  and so on. These data can be used to create models, e.g. to predict demand for goods from Category #1 from Сustomers from the Segment #1. The data for the analysis are automatically loaded and precalculated in the DWH so you don’t have to spend financial resources on specialists’ salaries to get analysis-ready information. This also negates the possibility of human error. A data warehouse is different from a database in that it contains aggregated and calculated data for analytical purposes. This is why you can’t do without a DWH if you need analytics for making business decisions. Data Warehouse Benefits for Businesses It’s better to explain the benefits of data warehouse using a contrario reasoning: what you could lose without Data Warehouse? You could lose without DWH: The confidence that your BI tool will run at all. The risk of performance issues (hanging, and crashing) is close to 100% without DWH when yoг deal with the big amount of data. Rather than analyzing data, you will waste time waiting for your BI tool to just work for you. The confidence that your BI tool will work correctly. The risk of business data loss is close to 100% without DWH. Would you like to make mistaken decisions just because the software does not load all the necessary data without you knowing it? Need Data Warehouse Development? Risk of Performance Issues without Data Warehouse Let’s imagine that the source database is your accounting software (like Quickbooks etc.) or your CRM software (like Salesforce or Zoho etc). And you connected it directly to the BI tool (like POWER BI or any else) WITHOUT DWH to get insightful reports and dashboards. You could face the following performance issues while downloading data from the source database. 1. Performance Issues with the source database Let’s imagine that on Monday, at 9 AM the part of your staff is trying to fill the QuickBooks/Salesforce database with new transactional data, and the rest of your staff using POWER BI is trying to get reports from the same QuickBooks/Salesforce database. In this case, both QuickBooks/Salesforce and POWER BI may become unresponsive because high-load resource-intensive POWER BI requests slow down the source database performance. In fact, your staff will waste time waiting for the software to just work. If you connected your accounting/CRM software with the BI tool WITH DWH you prevent such a challenge. With a DWH, performance issues with the source database could be excluded completely because the data will be loaded not from the source database directly, but from the DWH. In turn, the DWH automatically extracts all the data from the source database beyond regular working time, for example at night without hampering others' work. 2. Performance Issues with the BI tool  BI tools always load raw data for analysis (e.g. every transaction for every client at every moment of time). But analytics requires aggregated data (e.g. total monthly sales by product group). These data need to be aggregated and calculated with some sort of software. In this example, we are talking about POWER BI installed on your computer. Its speed depends on the hardware of your computer. So if these PCs weren’t built for such tasks, they can freeze, especially if the volume of data is huge. (A retail shop, for example, can reach 100,000 transactions per day, and to analyze sales over 6 months POWER BI has to process around 2 million transactions or lines of data). Moreover, if you would like to look at the report you’ve been waiting for from a different viewpoint by applying a filter, all the calculations will be redone, because aggregated data wasn’t saved anywhere. A lot of time will be spent waiting for the reports. In fact, WITHOUT a DWH or using in-memory approach you will waste time waiting for your BI tool to just work. WITH a DWH, performance issues with the BI tool could be excluded completely because all aggregations and calculations are premade beforehand in DWH. And you get ready-for-analysis data. WITH a DWH, your BI tool does not spend resources on aggregations and calculations. Risk of Business Data Loss without Data Warehouse At which stages of working with a BI tool could business data loss happen? 1. Errors during the BI data update from a database source Suppose you press the “refresh” button in POWER BI to view the dashboard with the current information from your accounting software of CRM. But this is what could happen: 1.1. Data loss due to the temporary disconnection during the load.  Live loading of data takes time, say about 1 minute. Data exchange almost always happens over the network, be it a local one or the Internet. If there was a glitch during the load time, some data won’t load in the POWER BI. As a result, some sales over a certain period won’t get into the reports, your analytical conclusions would be incorrect, and you won’t even notice that. If the data from the accounting software or a CRM went through a DWH before being uploaded to POWER BI, your DWH would automatically check it for consistency (e.g. by checksum verification). Should the error occur, the DWH will load the missing data automatically.  1.2. Inability to access the data source because of the request limit Suppose you’ve launched a Google Ads marketing campaign for several product groups. You need to estimate your advertising material efficiency for each of them. But you want to not only see which ads are clicked on, but which clicks get converted to revenue so you know where to put your budget to maximize your ROI. To solve this problem you need to upload your QuickBooks sales data filtered by dates and commodity groups and combine it with the Google Ads data on clicks for each ad. But you can only get the Google Ads data via API, which has API Limits and Quotas. The more of your employees need to get such reports and the more reports are compiled daily, the quicker you spend your quota. If you try to get another report after your limit has been reached, you won’t get data. The source would be inaccessible. If the Google Ads data was loaded to a DWH before being transferred to POWER BI you wouldn’t have to make multiple Google Ads requests and use up your limits. You will just use the data that was requested once and stored in the DWH. 1.3. Denial of access to the data source. No connection to a remote DB. Suppose you urgently need to get a report, but there is no connection with a remote DB, for example with QuickBooks Online or Salesforce CRM, because there is maintenance going on. As a result, at 9 AM on Monday you can’t even get the Friday reports, let alone the current ones. If your CRM or accounting software data was routed through DWH before getting to POWER BI, you would still be able to get the reports based on the latest upload. As a rule, the upload happens at least once per day according to the predetermined schedule in the DWH. And if the DWH can’t access the source, it uses a scheduler, using which any process can be automated to run at predefined intervals. The DWH will try over and over again until it gets the data. You can perform synchronizations as frequently as every 5 minutes. 1.4. No access to the historical data at the source If you use third-party resources for getting data (e.g. SaaS platforms) their owners can wilfully clear your historical data and old transactions they deem not relevant anymore. Or they can push you towards using a more expensive subscription plan.  They do it because they don’t want to expand their DB servers, which costs money.  Routing the data from third-party resources to the DWH before it gets sent to POWER BI makes you independent of the third-party data storage policies. 2. Errors during data entry in the source DB For example, your employee could erroneously enter the customer in the CRM or accounting software as “Dylan Soulfrank” while he already exists there as “Dylan Soilfrank” - one letter is different. QuickBooks or Salesforce will perceive it as two separate clients. As a result, you’ll get “Dylan Soulfrank” as a new customer, while “Dylan Soilfrank” will become a lost client because of no new transactions. If you are making a personal customer forecast based on regression (turning to historical data), the data for both accounts would be wrong and you will make an incorrect sales estimate. If the data from your accounting software or a CRM was routed through DWH before getting into POWER BI, your data warehouse expert would notice the spelling error in QuickBooks and would suspect a duplicate. This can be checked and fixed either in the QuickBooks DB, or in the DWH itself. As you can see, connecting a source DB and the BI tool is not enough. You need to think about the place to aggregate and precalculate data and save the calculations. There are technical reasons preventing you from keeping this information in the source DB, as we’ve discussed in the article about differences between data warehouse and database. So you have only one option remaining: store the calculations data within RAM, which will lead to data loss and performance issues. This is why the concept of DWH was developed.
Dmitry Baraishuk • 7 min read
Data Warehouse vs Database
Talk to our data warehouse consultants Data Warehouse vs Database Of course, when all you have is a hammer everything looks like a nail. The more detailed picture demonstrates that it's more cost-effective to use the right tool for the job. A Database is used for storing the data. A Data Warehouse is used for the analysis of data. Database You are using a Database (DB) during your daily activities for entering, storing and modification transactional (that is, statistical) business data.  This can be detailed information about what you sold to whom and when: the Сustomer #1 from Segment #1 bought three units of the SKU#1 on the 10th of March 2020).  There can be tens of thousands of such entries per day. So you can’t use these data as a basis for decision making without initial preparation.  To prepare the data for analysis, you have to :  download the data from the DB; upload it to the special software (e.g. Excel, Power BI, Tableau, etc.); make your calculations. The more calculations you need to do, the more time they take, and the higher the chances of making a mistake are.  Only after this, the data can be used for decision making. Data Warehouse A Data Warehouse (DWH), as usual, is a set of databases. A data warehouse stores both statistical and aggregated data. A DWH is created primarily to analyze data for decision making.  A DWH could be the source of the following aggregated and calculated data: Total Sales (by Location, Category, SKU, Period, and more). For example, all Сustomers from Segment #1 bought 100 000 units of goods from Category #1 brought $1,000,000 in March 2020; Total Sales Growth (by Location, Category, SKU, and more). For example, it increased by 100,000$ or 10% in March 2020 compared with March 2019.  Budget Vs. Actual (by Location, Category, Period, Сustomer Segment, and more). For example, the actual variance is $10,000 or -10%.  and so on. These data can be used to create models, e.g. to predict demand for goods from Category #1 from Сustomers from the Segment #1. The data for the analysis are automatically loaded and precalculated in the DWH so you don’t have to spend financial resources on specialists’ salaries to get analysis-ready information. This also negates the possibility of human error. A data warehouse is different from a database in that it contains aggregated and calculated data for analytical purposes. This is why you can’t do without a DWH if you need analytics for making business decisions. Using BI without DWH you could face such risks as: Business data loss. Risk of incorrect analytics due to business data loss (loss of data due to temporary connection glitch, denial of access to the data during report generation, loss of access to the historical data due to its deletion at the source). Performance issues. Using analytics could be impossible due to the BI-tool freezing, crashing, or becoming unresponsive. Check out other benefits of a data warehouse.
Dmitry Baraishuk • 2 min read

Our Clients' Feedback

zensai
technicolor
crismon
berkeley
hathway
howcast
fraunhofer
apollomatrix
key2know
regenmed
moblers
showcast
ticken
Next slide
Let's Talk Business
Do you have a software development project to implement? We have people to work on it. We will be glad to answer all your questions as well as estimate any project of yours. Use the form below to describe the project and we will get in touch with you within 1 business day.
Contact form
We will process your personal data as described in the privacy notice
This site is protected by reCAPTCHA and the Google Privacy Policy and Terms of Service apply
Call us

USA +1 (917) 410-57-57

UK +44 (20) 3318-18-53

Email us

[email protected]

to top