Belitsoft > Reliable Power BI Development Company

Reliable Power BI Development Company

Our team of talented and detail-oriented Power BI developers translates complex data sets into user-friendly, visually appealing, and interactive dashboards that highlight key insights and trends. We tap into various data sources to create stunning visualizations, whether the data is stored on-premises or in the cloud, using resources like Excel, OneDrive, SQL Server, and more.

PowerBI Business Intelligence Services

After you get PowerBI from Microsoft, we can link it to your data quickly. But years of expertise show direct data linking isn't always the best. That's why we've developed a proven method to effectively implement PowerBI in your business.

Power BI Dashboard Design

We have assisted many businesses in creating and tailoring personalized Power BI Dashboards that perfectly align with their brand image and corporate workflow. We create user-friendly dashboards, select visualizations, and configure data connections to make data analysis easier.

Power BI Development

Our Power BI Developers specialize in creating advanced corporate Power BI solutions that offer scalability, collaboration, and rich content. This service involves data modeling, data extraction, transformation, and loading (ETL), report creation, visualizations, implementation of data security measures, and performance optimization for end users, ensuring quick load times. We optimize data extraction jobs from multiple data sources and have experience working with large datasets.

Integration with Power BI

Our Power BI experts are adept at seamlessly integrating your Power BI solution with any third-party or internal CMS (Content Management System) or DMS (Document Management System) you use. They leverage open, standards-based REST APIs to incorporate your application or service with Power BI effortlessly.

Support & Maintenance

Our dedicated team of Power BI experts and support professionals is available round the clock, 24/7, to assist you with any challenges or issues you may encounter. With experience working under tight deadlines and in high-pressure situations, they ensure that your input, concerns, and queries are promptly addressed with swift responsiveness.

Power BI Consulting Services

Our Power BI consultants help organizations effectively implement and utilize Microsoft Power BI, a business intelligence and data visualization tool. Consultants work closely with organizations to understand their business objectives, data requirements, and reporting needs. This involves assessing the existing data infrastructure, identifying data sources, and determining the desired outcomes.

Power BI Predictive Analytics

Our Power BI consultants assist you in analyzing and predicting patterns within the ever-evolving business environment of customers, clients, prospects, and partners. They help you uncover valuable insights from the data to understand the dynamics and make informed decisions.

Whether it's about hiring Power BI experts, choosing the right Power BI tool, or performing a comprehensive analysis of your business with a single click - we are here to talk.

Challenges of Direct PowerBI Connection
Limitations in managing complex data tasks due to a lack of custom algorithms for multi-source data integration and special calculations
Efficiency issues using a single database for both daily operations and analysis, causing potential slowdowns and bottlenecks
Limited scalability due to 2 GB file size cap, hindering larger data sets expansion and management
arrow to bottom

OUR SOLUTION

Custom PowerBI Connection
Custom ETL components for efficient complex data operations
Performance enhancement through a dedicated Data Warehouse
Scalability improved with a modern ETL module and Tabular Cube

Data Visualization Services with PowerBI

You provide the data, and we create the necessary data management architecture. We then visualize this data to give you clear, actionable insights
data visualization services powerbi

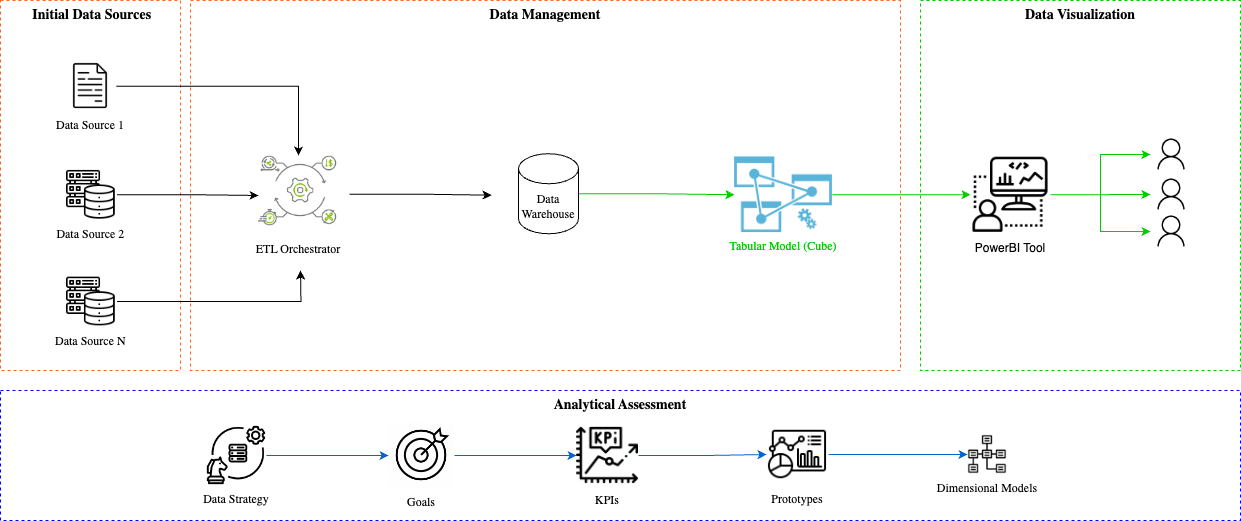
Analytical Assessment

To create an analytical strategy, our Power BI development experts analyze how things are done, your goals, and decide on KPIs

Our data audits befor PBI software development involve collecting regional and industry information, analyzing market trends, and assessing company-specific factors

Data Management

Our system supports 100+ types of data sources (files, databases, cloud services, etc.) and ingests various data formats (relational, IoT, big data)

We keep your data well-organized for quality transformation

We run ETL procedures to integrate, clean, and enrich your data

Your data is secured through encryption, with workspace-level access to authorized users and row-level security for granular data visibility control

Data Visualization

Our team designs, develops, and implements PowerBI data visualization

Our insightful reports and visualizations are easily understood by all departments

We consolidate and visualize business data in one place using charts, cards, and maps

We can also add AI/ML modules on demand for advanced and predictive analysis

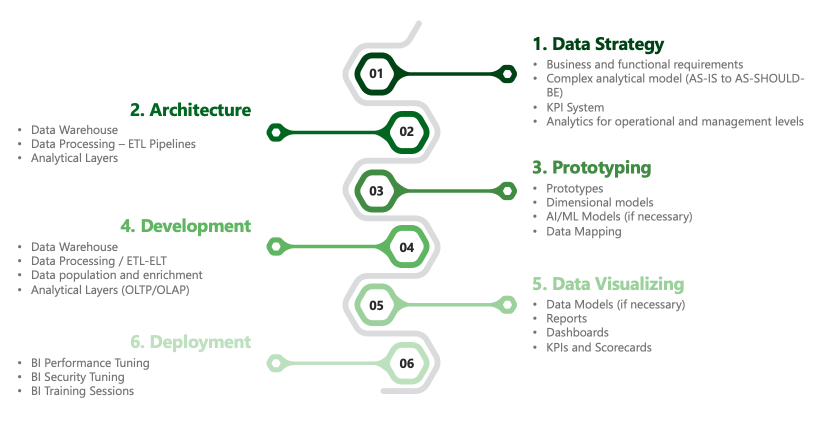
How We Build Your PowerBI Solution

business intelligence powerbi
Our PowerBI Expert Team

In our approach, we don't assign one person to handle multiple responsibilities. Instead, we have speacialists who manage each aspect of the work in their respective fields. This guarantees high-quality and professional outcomes

BI Business Analyst

  • Requirement gathering
  • Data stories
  • Data mapping
  • Data verification
  • QA

BI Project Manager

  • Requirement gathering
  • Estimation & budget
  • Resource management
  • Project rituals & artefacts
  • Reporting & Closing

BI Architect/ Tech Lead

  • Architecture & Tech Stack
  • Tech team management
  • Project planning
  • Tech audit

BI DevOps

  • Environments configuration
  • Connection configuration
  • Security management
  • Productivity refinement

Data Engineer

  • DWH configuration
  • ETL/ELT Pipelines
  • ETL/ELT scripts
  • Data quality
  • Data transformation & enrichment
  • Analytical layer configuration

Data Scientist/ Data Analyst

  • Data strategy
  • Complex Analytical models
  • Prototyping
  • Dimensional models
  • Data modelling
  • Data vizualization

It's Easy to Hire Power BI Developers With Belitsoft

Depending on the size and growth of your products and services, you might need the assistance of a Power BI developer or even a remote developer team to ensure the smooth operation of your business. If you're a startup or a company building an MVP, your product is likely to expand beyond its initial framework. Hiring dedicated developers can ensure that your Power BI solutions remain up-to-date and in sync with your evolving needs.

  • Share your project. Tell us about your project, and we will recommend developers from our talent pool who are best suited to translate data needs of your business stakeholders into dashboard requirements.
  • Plan your strategy. During this stage, we'll establish the specifics of our collaboration, including the scope of work for the developers, the hiring model, and the designated time frames.
  • Interview️ candidates. Receive vetted candidate profiles that match your engineering needs. We typically offer multiple options for skilled developers in various technologies. You can assess the proficiency level of our Power BI developers, using your preferred qualification tests, to ensure they have the necessary experience in the tools and technologies your project requires.
  • Hire developer candidates. When ready, select a developer to hire. The developer will be employed by us, but you will have complete control over their assigned tasks and work responsibilities.
  • Team Scaling. We offer you the flexibility to adjust your Power BI development team size according to the project scope, whether that requires expanding or reducing the number of team members.

Flexible Hiring Model For Power BI Developers

Fixed Price
For startups and small businesses with projects where the development time and cost can be estimated, our fixed price model could be the best fit. After evaluating your project idea, we'll provide a quote. Upon approval, you can begin working with your dedicated resource.
Dedicated Power BI Developers
For businesses tackling substantial and complex projects, hiring a dedicated developer or an entire team of Power BI developers can provide focused and tailored expertise. This model is particularly useful for startups scaling their operations and mid-sized businesses seeking specialized skills.
ideas-s
support-s
Hourly Basis
For initiatives with an extensive scope and ongoing modifications, our hourly basis model provides the most flexibility. This pay-as-you-go model allows you to hire Power BI developers as needed, making it an excellent choice for large projects and entrepreneurs requiring expert support throughout the project lifecycle.

Technologies and tools we use

Power BI Development
Analytics
PowerBI Service
Azure Analysis Services
Data Storing and ETL
Azure Data Fabric
Azure Data Factory
Azure SQL
Database
MariaDB
MySQL
PostgreSQL
Azure Data Lake
Stay Calm with No Surprise Expenses

Stay Calm with No Surprise Expenses

  • You get a detailed project plan with costs associated with each feature developed
  • Before bidding on a project, we conduct a review to filter out non-essential inquiries that can lead to overestimation
  • You are able to increase or decrease the hours depending on your project scope, which will ultimately save you a lot of $
  • Weekly reports help you maintain control over the budget
Don’t Stress About Work Not Being Done

Don’t Stress About Work Not Being Done

  • We sign the Statement of Work to specify the budget, deliverables and the schedule
  • You see who’s responsible for what tasks in your favorite task management system
  • We hold weekly status meetings to provide demos of what’s been achieved to hit the milestones
  • Low personnel turnover rate at Belitsoft is below 12% per annum. The risk of losing key people on your projects is low, and thus we keep knowledge in your projects and save your money
  • Our managers know how to keep core specialists long enough to make meaningful progress on your project.
Be Confident Your Secrets are Secure

Be Confident Your Secrets are Secure

  • We guarantee your property protection policy using Master Service Agreement, Non-Disclosure Agreement, and Employee Confidentiality Contract signed prior to the start of work
  • Your legal team is welcome to make any necessary modifications to the documents to ensure they align with your requirements
  • We also implement multi-factor authentication and data encryption to add an extra layer of protection to your sensitive information while working with your software
No Need to Explain Twice

No Need to Explain Twice

  • With minimal input from you and without overwhelming you with technical buzzwords, your needs are converted into a project requirements document any engineer can easily understand. This allows you to assign less technical staff to a project on your end, if necessary
  • Communication with your agile remote team is free-flowing and instantaneous, making things easier for you
  • Our communication goes through your preferred video/audio meeting tools like Microsoft Teams and more
Mentally Synced With Your Team

Mentally Synced With Your Team

  • Commitment to business English proficiency enables the staff of our offshore software development company to collaborate as effectively as native English speakers, saving you time
  • We create a hybrid composition, where our engineers work with your team members in tandem
  • Work with individuals who comprehend US and EU business climate and business requirements

Frequently Asked Questions

Microsoft Power BI is a comprehensive collection of business intelligence tools. It helps to import, aggregate, and present data in immersive reports and visuals. The suite includes:

  • Power BI Desktop: A Windows desktop application for creating detailed data analysis and reporting
  • Power BI Service: An online platform for collaborating and distributing Power BI reports
  • Power BI Report Server: An on-premises server to host Power BI reports, available with Premium licensing
  • Power BI Embedded: A service to embed Power BI visuals, reports, and dashboards into your applications, creating a cohesive user experience
  • Power BI Mobile: A mobile application that allows you to access Power BI reports on the go
  • Power BI Report Builder: A tool for creating detailed paginated reports

Our PowerBI visualization and analytical solutions are tailored to enhance decision-making and operational efficiency in various job functions and industries:

  • Corporate and management, streamlining high-level strategic planning and reporting
  • Customer service, optimizing interaction tracking and resolution analytics
  • Finance & Accounting, simplifying financial data consolidation and reporting
  • Human Resources, improving workforce analytics and organizational insights
  • Information Technology, managing IT service data and infrastructure analytics
  • Marketing, both digital and traditional, for campaign analysis and ROI optimization
  • Manufacturing, monitoring production processes and efficiency metrics
  • Sales, analyzing sales trends and performance metrics
  • Supply Chain and Logistics, optimizing logistics planning and supply chain visibility
  • We can also customize our solution to meet your specific requirements and address other business tasks

Experienced Power BI developers handle a variety of responsibilities, including:

  • Developing and managing Power BI
  • Building intuitive dashboards, visual reports, KPI scoreboards
  • Connecting with various data sources, transforming data for BI and importing it
  • Constructing analysis services and reporting models
  • Implementing low-level security and understanding the application security layer model
  • Creating compatible multidimensional and tabular models
  • Closer business monitoring thanks to rich and intuitive dashboards,
  • Interactive reports, visualizations, and personalized dashboards for a single view,
  • High level of security, privacy, compliance, and transparency with separate cloud data centers,
  • Simple to use with a short learning curve,
  • Low cost and fast turnaround,
  • Frequent updates and up-to-date features and functions.

Yes, we can perform data modeling with Power BI, which is one of its key advantages compared to other business intelligence platforms. Power BI development enables you to effortlessly create advanced models that can address intricate data-related inquiries.

  • Designing data models to transform raw data into valuable insights
  • Developing interactive dashboards and visual reports
  • Identifying and monitoring key performance indicators (KPIs)
  • Analyzing and presenting data through easily understandable reports
  • Establishing relationships between data sources and creating demonstrative data models
  • Creating charts and documentation to explain algorithms, models, and relationships
  • Designing, developing, testing, and deploying Power BI scripts
  • Performing in-depth analytics
  • Executing DAX queries and functions
  • Analyzing and refining the current ETL process if necessary
  • Developing a data warehouse and working with SSAS, SSIS, and SSRS
  • Enhancing existing BI systems through redefinition and strategic/technical changes
  • Creating custom charts and implementing custom calculations
  • Utilizing SQL queries for optimal results
  • Applying filters and graphs to facilitate data comprehension
  • Collaborating with colleagues from various departments to gather suggestions for performance improvement.

The must and nice-to-have skills to look for when hiring Power BI developers are:

  • Experience working with BI tools or in a data-focused role
  • Proficiency in database management, SQL querying, data modeling, data warehousing, BI, and online analytical processing (OLAP)
  • Familiarity with data science, BI, and data analytics concepts
  • Understanding of data integration, data warehousing, BI, and presentation principles
  • Hands-on experience with various BI tools and systems
  • Ability to create data-rich dashboards, write DAX expressions, and implement low-level security in Power BI
  • Capability to develop custom BI products using scripting and programming languages like R and Python
  • Skill in transforming data into compelling narratives to facilitate data-driven decision-making
  • Extensive knowledge and practical experience with Microsoft Business Intelligence stacks such as Power Pivot, SSRS, SSIS, and SSAS
  • Analytical mindset and adeptness in problem-solving
  • Effective communication of insights through charts, reports, and dashboards for clear understanding by all stakeholders
  • Proficiency in developing custom BI solutions
  • Strong interpersonal and client management skills
  • Ability to adapt and respond quickly to evolving business requirements
  • Commitment to staying updated with design and development best practices.

At Belitsoft, we carefully evaluate all our remote Power BI developers before introducing them to you. This ensures that only top-tier candidates — those who have excelled in our technical and communication assessments — are presented for your consideration. We aim to provide you with suitable options within days or weeks, depending on your company's specific requirements.

Based on the U.S. Bureau of Labor Statistics, software developers in the U.S. earned a median annual salary of $120,730 in May 2021. This translates to an hourly rate of approximately $70-100. It's important to note that this figure does not cover the additional expenses associated with hiring, which typically amount to around $4000 per new employee, according to Glassdoor.

The annual salary of your remote Power BI developers can vary significantly based on factors such as their years of experience, technical skills, education, and country of residence. However, in general, if the developer is based in Eastern Europe or Latin America, the hourly rate is typically 2 or 3 times lower compared to the US, UK, and Israel.

You can access Power BI for free, but the best experience comes with a Power BI Pro Subscription account, which you can purchase from the Microsoft Store. Many businesses opt for a subscribed account because it provides them with enhanced features compared to the free version.

Self-service BI is an approach to data analytics, reporting, and visualization that empowers users to create user-friendly dashboards independently. It allows users to easily handle data ingestion, process it, and conduct business operations smoothly. Analyzing data is straightforward and doesn't require complex programming code. Users can generate actionable dashboards without relying on third-party vendors, thereby eliminating any associated constraints.

On the other hand, managed Enterprise BI involves data flowing from multiple sources and is typically used by businesses for their operations. However, managed Enterprise BI can sometimes hinder effective business operations due to a potential lack of collaboration and valuable insights during data analysis. Companies often turn to outside vendors to refine their data sources, leading to budget limits and decreased productivity.

Portfolio

BI Modernization for Financial Enterprise for 100x Faster Big Data Analysis
FinTech BI Modernization for 100x Faster Big Data Analysis
A private financial enterprise needed to fully modernize the architecture of a custom Business Intelligence system to effectively identify trends, mitigate risks, enhance customer experience, and optimize operations.
Power BI Inventory Management to Prevent Over- and Understocking
Our client is one of the largest retail suppliers who is tracking millions of records across multiple retail stores in different cities and would like to know how to walk the fine line between over- and understocking.
Migration from Power BI service to Power BI Report Server
Last year, the bank migrated its financial data reporting system from a cloud-based SaaS hosted on Microsoft’s cloud platform to an on-premises Microsoft solution. However, the on-premises Power BI Report Server comes with some critical limitations by default and lacks backward compatibility with its cloud equivalent.

Recommended posts

Belitsoft Blog for Entrepreneurs
Transitioning to Microsoft Fabric from Power BI Premium
Technical and Organizational Capabilities Required To migrate from Power BI Premium to Microsoft Fabric, companies need to build up both the tech skills and the organization’s muscle to handle the shift. Broad Technical Skill Set Fabric brings everything under one roof: data integration (Data Factory), engineering (Spark, notebooks), warehousing (Synapse SQL), and classic BI (Power BI). But with that comes a shift in expectations. Knowing Power BI isn’t enough anymore. Your team needs to be fluent in SQL, DAX, Python, Spark, Delta Lake. If they are coming from a dashboards-and-visuals world, this is a whole new ballgame. The learning curve is real, especially for teams without deep data engineering experience. Data Architecture & Planning Fabric is a greenfield environment, which means full flexibility, but zero guardrails. No out-of-the-box structure, no default best practices. That’s great if you’ve got strong data architects. If not, it’s a recipe for chaos. Building from scratch means you need to get it right early: workflows, pipelines, modeling. Think long-term from day one. Use of medallion architecture in OneLake is a good example of doing it right. In highly regulated sectors like healthcare and fintech, a BI consultant with domain knowledge can help define early architecture that supports compliance, governance, and long-term scalability from the ground up. Cross-Functional Collaboration Fabric brings everyone into the same space: data engineers, BI devs, data scientists. The roles that used to sit apart are now working side by side. That’s why it’s not just a platform shift, it’s a team shift. Companies need to start building cross-disciplinary teams and getting departments to actually collaborate; not just hand stuff off. In some cases, that means spinning up a central DataOps team or a center of excellence to keep things from drifting. Governance and Data Management Companies should have or develop capabilities in data governance, security, and compliance that span multiple services. Fabric doesn’t automatically centralize governance across its components, so skills with tools like Microsoft Purview for metadata management and lineage can help fill this gap. Role-based access controls, workspace management, and policies need to be enforced consistently across the unified environment. DevOps and Capacity Management Fabric isn’t set-it-and-forget-it. It runs on Azure capacities, and depending on how you set it up, you might be dealing with a pay-as-you-go model instead of fixed capacity. That means teams need to know how to monitor and tune resource usage: things like how capacity units get eaten up, when to scale, and how to schedule workloads so you are not burning money during off-hours. Without that visibility, performance takes a hit or costs spiral. A FinOps mindset helps here. Someone has got to keep an eye on the meter. Training and Change Management Teams used to Power BI will need training on new Fabric features (Spark notebooks, pipeline orchestration, OneLake, etc.). Given the multi-tool complexity of Fabric, investing in upskilling, workshops, or pilot projects will help the workforce adapt. Leadership support and clear communication of the benefits of Fabric will ease the transition for end-users as well as IT staff. Common Migration Challenges and Pitfalls Moving from Power BI Premium to Fabric isn’t always smooth. There are plenty of traps teams fall into early on. Knowing what can go wrong helps you plan around it and avoid wasting time (or budget) fixing preventable problems. Fabric introduces new tools, new architecture, and a different pricing model. That means new skills, planning effort, and real risk if teams go in blind. The pain comes when companies skip the preparation stage. Tooling Complexity & Skill Gaps One of the big hurdles with Fabric is the skill gap. It casts a wide net: no single person or team is likely to have it all from the start. You might have great Power BI and DAX folks, but little to no experience with Spark or Python. That slows things down and leads to underused features. Mastering Fabric requires expertise across a wide range of tools spanning data engineering, analytics, and BI. Without serious upskilling, teams risk falling back on old habits, like using the wrong tools for the job or missing what Fabric can actually do. Steep Learning Curve & Lack of Best Practices Fabric is still new, and the playbook is not fully written yet. Microsoft offers docs and templates (mostly lifted from Synapse and Data Factory) but there is no built-in framework for how to actually structure your projects. You are starting with a blank slate. That freedom can backfire if teams wing it without clear guidance. Without predefined standards, organizations have to create their own rules: workspace setup, naming conventions, data lake zones, all of it. And until that settles, most teams go through a trial-and-error phase that slows things down. Fragmented or Redundant Solutions Fabric gives you a few different ways to do the same thing, like loading data through Pipelines, Dataflows, or notebooks. That sounds flexible, but it often leads to confusion. Teams start using different tools for the same job, without talking to each other. That is how you end up with duplicate workflows and zero visibility. Unless you set clear rules on what to use and when, things drift fast. Capacity and Licensing Surprises Fabric doesn’t use fixed capacity like Power BI Premium. It runs on compute units: scale up, down, pause. You pay for usage. Sounds fine. Until you get the bill. Teams pick F32 to save money. But anything below F64 drops free viewing. Now every report needs a Pro license. Under Premium? Included. Under Fabric? Extra cost. And most teams don’t see it coming. Plenty of companies that switched to F32 thinking they were optimizing costs got hit later with Pro license expenses. Want the same viewer access as P1? You’ll need at least F64. That can cost 25–70% more, depending on setup. There are ways to manage it (annual reservations, Azure commit discounts) but only if you plan before migration. Not after. Data Refresh and Downtime Considerations The mechanics of migrating workspaces are straightforward (reassigning workspaces to the new capacity), but there are operational gotchas. When you migrate a workspace, any active refresh or query jobs are canceled and must be rerun, and scheduled jobs resume only after migration. If not carefully timed, this could disrupt data refresh schedules. Customers may need to “recreate scheduled jobs” or at least verify them post-migration to ensure continuity. Planning a hybrid migration (running old and new in parallel) can mitigate disruptions. Rely on Belitsoft technology experts to use their in-depth knowledge, broad expertise, and strategic thinking to assist you in legacy migration to Microsoft Fabric, while minimizing downtime and ensuring continuity. Resource Management Pitfalls Fabric lets you pause or scale capacity. Sounds like a good way to save money. But when a capacity is paused, nothing runs — not even imported datasets. Reports go dark. Companies with global teams or 24/7 access needs quickly learn: pausing overnight isn’t an option. There’s another catch: all workloads share the same compute pool. So if a heavy Spark job or dataflow kicks off, it can choke your BI reports unless you plan around it. Premium users didn’t have to think about this: those systems were separate. Now it’s on you to tune compute (CUs), schedule jobs smartly, and monitor usage in real time. Ignore that, and you’ll hit capacity walls: slow reports, failed jobs, or both. Pricing and Licensing Differences One of the biggest changes in moving to Fabric is the pricing and licensing model. Below is a comparison of key differences between Power BI Premium (per capacity) and Microsoft Fabric. Aspect Power BI Premium (P SKUs) Microsoft Fabric (F SKUs) Capacities and Scale Fixed capacity tiers P1–P5 (e.g. P1 = 8 v-cores). No smaller tier below P1. Scaling requires purchasing the next tier up. Flexible capacity sizes (F2, F4, F8, F32, F64, F128, …). Can choose much smaller units than old P1 if needed. Supports scaling out or pausing capacity in Azure portal. Included Workloads Analytics limited to Power BI (datasets, reports, dashboards, AI visuals, some dataflows). Other services (ETL, data science) require separate Azure products. All-in-one platform: Includes Power BI (equivalent to Premium features) plus Synapse (Spark, SQL), Data Factory, real-time analytics, OneLake, etc. Superset of data capabilities. User Access Model Unlimited report consumption by free users on content in a Premium workspace (no per-user license needed for viewers). Unlimited free-user consumption only on F64 and above. Smaller SKUs require Pro/PPU licenses for viewers. On-Premises Report Server Power BI Report Server (PBIRS) included with P1–P5 as dual-use right. PBIRS included with F64+ reserved capacity. Pay-as-you-go SKUs need separate license. Purchase & Billing Purchased via M365 admin center as subscription (monthly/annually). Fixed cost. Not counted toward Azure commitments. Purchased via Azure (Portal or subscription). Pay-as-you-go or reserved. Eligible for Azure Consumption Commitments (MACC). Cost Level (Capacity) P1 = $4,995/month. Higher SKUs scale linearly (P2 ~$10k, P3 ~$20k). F64 = ~$8,409.60/month pay-as-you-go. F32 = ~$4,204.80/month. More features included. Scaling and Pausing No dynamic scaling. Capacity is always running. No pause option. Can scale up/down or pause capacity in Azure. Pausing stops charges but also suspends access. Future Roadmap Power BI Premium per capacity is being phased out (no new purchases after 2024; sunset in 2025). Fabric is the future. All new features (Direct Lake, Copilot, OneLake) are in Fabric. Key takeaways on pricing/licensing Existing Power BI Premium customers will need to transition to an F SKU at their renewal (unless on a special agreement). In doing so, they should prepare for potential cost increases at equivalent capacity levels, although Fabric’s flexibility (smaller SKUs or scaling down) can offset some costs if used wisely. The benefits of Fabric’s model include more granular scaling, alignment with Azure billing (useful if you have Azure credits), and access to a broader set of tools under one price. The downsides include complexity in cost management and the need to adjust to Azure’s billing cycle. Careful analysis is recommended to choose the right capacity (F SKU) so that performance and user access needs are met without overspending. Use Cases and Success Stories of Fabric Migration Several organizations have already made the leap from Power BI Premium to Microsoft Fabric. These real-world case studies highlight the motivations for migration and the benefits achieved. Flora Food Group – Consolidation and Real-Time Insights Flora Food Group, a global plant-based food company, was juggling Synapse, Data Factory, and Power BI as separate tools. Too many moving parts. They decided to consolidate everything into Fabric. The move wasn’t rushed. They ran Fabric alongside their legacy stack and started with the big datasets. They used a medallion architecture (bronze-silver-gold) in OneLake to build a single source of truth. From there, the upside came fast: Unified setup — reporting, engineering, science, and security in one stack Better reporting — centralized semantic models made data reuse easy Direct Lake — killed the need for scheduled refreshes; reports now pull fresh data near real time Lower waste — idle compute from one workload now powers another Faster BI teams — integrated tools meant fewer handoffs and less prep time According to their Head of Data & Insight, the migration simplified their architecture and cut costs, while boosting capability. They see it as a strategic step toward what’s next: AI-powered analytics with Fabric Copilot. BDO Belgium – Scalable Analytics for Mergers & Acquisitions BDO Belgium was hitting walls with Power BI Premium, especially during M&A due diligence, where speed and clarity are non-negotiable. So they built a new analytics platform on Fabric. They called it Data Eyes. The shift paid off: Faster insights — better performance on large, complex datasets Self-service access — finance teams explored data without writing code One interface — familiar to users, powerful at scale Simpler backend — IT maintains one platform, not a patchwork Fabric gave them what Power BI alone couldn’t: a system that handles scale and puts data in the hands of non-technical users. For BDO, it wasn’t just an upgrade; it changed how the business works with data. Other Early Adopters Many organizations that were already invested in the Microsoft data stack find Fabric a natural progression.  Some companies reported that Fabric’s unified approach streamlined their data engineering pipelines and BI. They cite benefits like reducing data duplication (thanks to OneLake) and easier enforcement of security in one place rather than across multiple services.  Fabric’s integration of AI (Copilot for data analysis) is seen as an advantage.  The pattern is that companies migrating from Power BI Premium experience improvements in data freshness, collaboration, and total cost of ownership when they leverage the full Fabric ecosystem of tools. Value comes from utilizing Fabric’s broader capabilities rather than treating it as a like-for-like replacement of Power BI Premium.  Organizations that approach the migration as an opportunity to modernize their data architecture (as Flora did with medallion architecture and real-time data, or BDO did with an intuitive analytics app) tend to reap the most benefits. They achieve not just a seamless transition of existing reports, but also new insights and efficiencies that were previously difficult or impossible with the siloed tool approach. Implications of Not Migrating to Fabric Given Microsoft’s strategic direction, companies that choose not to migrate from Power BI Premium to Fabric face several implications in terms of features, support, and long-term viability. Feature Limitations Fabric isn’t just the next version of Power BI. It’s a superset. Staying on Power BI Premium means missing the features Microsoft is building for the future. No OneLake. No Direct Lake. No unified data layer. No Spark workloads. No Copilot. No built-in AI. Those are Fabric-only. If you stay on Premium, your analytics stack stays frozen. Fabric keeps evolving: with deeper integration, faster performance, and cloud-scale features. You can bolt on Azure services to replicate some of it, but that means extra setup, extra cost, and more moving parts. Support and Updates Microsoft is ending Power BI Premium per capacity SKUs. New purchases stop mid-2024. Renewals end in 2025. What that means: you’ll need to move to Fabric if you want to keep using the platform. There’s a temporary bridge: existing Premium customers can access some Fabric features inside their current capacity. But that’s a short-term patch. Not a strategy. Once your legacy agreement runs out, so does your support. No new features. No roadmap. Just a countdown to disruption. Fabric is the future. Microsoft’s made that clear.   Potential Cost of Inaction Delaying Fabric may seem easier in the short term, but the cost shifts elsewhere. Power BI Report Server won’t be bundled once Premium SKUs are retired. It will require separate licensing through SQL Server Enterprise + SA. Fabric also consolidates multiple tools (ETL, warehouse, reporting) into a single platform. Staying on the old stack means paying for them separately. Microsoft is offering 30 days of free Fabric capacity during transition. After that, migration gets more expensive and less flexible. Long-Term Roadmap Alignment After 2025, support for legacy Premium issues could slow down - because engineering focus will be on Fabric. Eventually, the Power BI Premium brand itself may disappear. Holdouts will face a bigger, messier migration later: with more change to absorb, less time to adapt. Early movers get the opposite: smoother transition, room to adjust, and a seat at the table. Microsoft is still shaping Fabric. Companies that migrate now can influence what comes next. Choosing not to migrate to Fabric is not a risk-free stance. In the immediate term (for those with existing Premium deployments), it means missing out on new capabilities and efficiencies. In the medium term (by 2025), it becomes a support risk as the old licensing model is phased out. While organizations can continue with Power BI Pro or Premium Per User for basic needs (these are not impacted by the capacity SKU retirement), larger scale analytics initiatives will increasingly require Fabric to stay on the cutting edge. Therefore, companies should weigh the cost of migration against the cost of stagnation. Most will find that a planned migration, even if challenging, is the prudent path to ensure they remain supported and competitive in their analytics capabilities. How Belitsoft can Help Fabric migration touches architecture, governance, training, and cost models. Experienced providers like Belitsoft have built services around it: assessment, design, workspace migration, policy setup, user onboarding. All mapped to Fabric’s structure. We use automation and phased rollout to reduce downtime and avoid rework. Engagements are flexible: fixed-price or T&M, depending on environment size and scope. With the right setup, you'll move faster and start using unified workloads, AI features, and performance gains. Fabric requires a diverse skill set spanning Power BI, SQL, Python, Spark, Delta Lake, and data engineering, far beyond traditional dashboard development. By outsourcing our BI development services, you get dedicated BI and data engineering experts with hands-on experience in Power BI modernization and migration to ensure a smooth transition, while introducing automated pipelines and AI-driven analytics. Contact for a consultation.
Alexander Suhov • 10 min read
Business Intelligence Consultant for Fintech
Fintech Segments That Hire Business Intelligence Consultants Neobanks (Digital-Only Banks) Digital banks don’t have branches or tellers. Their only real-world footprint is the data trail their users leave behind: login patterns, spend habits, churn events, drop-off flows.  BI in a neobank environment answers questions the CEO is already asking: Where are we “bleeding” in the funnel? What’s our fraud exposure today, not last quarter? Which users should we invest in retaining and which should we quietly let churn? Which features are sticky? And BI doesn’t just report; it drives actions. A consultant might flag a spike in failed logins in a specific zip code, triggering fraud mitigation protocols. Or identify a high-performing onboarding path that can be replicated in a new feature. These are the kinds of insights that move CAC, LTV, and NPS: the CEO-level numbers that ultimately determine valuation. Growth, Retention, and Spend Efficiency  Neobanks compete on slim margins. Every ad dollar has to work. That’s why BI consultants are often embedded with growth teams, analyzing: Which acquisition channels yield high-LTV customers? What’s our CAC by segment or cohort? Which incentives convert one-time users into daily ones? This isn’t just about visualizing the funnel but optimizing it. BI experts connect the dots between marketing analytics, in-app behavior, and user segmentation: you’re not just acquiring users but the right ones. In markets with high churn and expensive acquisition, that’s the difference between Series D and getting delisted. BI Drives Product  Product intuition in a digital bank is incomplete without analytics. BI consultants feed product managers the behavioral fuel they need to prioritize: Which parts of the registration flow lose the most users? Are users really using that new savings feature, or just clicking in and bouncing? Does adding another KYC step kill conversion or reduce fraud? Consultants surface these patterns early - often before they show up in revenue or support tickets. That’s what makes them so powerful. They shift teams from reacting to preempting. Chime is the example here. Their BI and analytics team sits with product and marketing: building the metric frameworks that define success, guiding feature rollout, and shaping long-term roadmap decisions. BI is part of their DNA, not an afterthought. In 2025, the firms that lead in fintech are insight machines. And the companies who know how to operationalize BI, not just to monitor, but to inform and optimize - are the ones building market advantages. When your fintech team needs more than just reports but real-time analytics, our experienced BI consultants and development team turn your data into action. We build custom dashboards, predictive models, and decision-ready analytics tools tailored to your product and users. Payment Platforms (Payments and Digital Wallets) The payment stack looks deceptively clean to the customer: swipe, tap, done. But under the hood? It’s a spiderweb: acquirers, processors, fraud engines, banks, FX services, regional gateways, and APIs that all have to handshake in milliseconds. Every one of those layers produces data. And unless you have the BI expertise to aggregate, reconcile, and interpret it - you’re blind. BI consultants in this space are solving hard problems: Why did a merchant’s authorization rate dip 3% last Thursday? Why is a specific gateway showing latency spikes during peak hours? Which payment methods are growing fastest by geography and margin? Without that clarity, you’re firefighting. Operational Intelligence Payment firms build dashboards tracking: Success vs. failure rates, by method and region Average transaction value and volume Latency by gateway, issuer, or network Error codes tied to specific banks or devices This data isn’t just for engineers - it’s for executives. A spike in transaction failures in Latin America? BI surfaces it first. A partner gateway degrading slowly across a week? The BI team shows the trend before support tickets pile up. This visibility directly protects revenue - by detecting performance issues before they become churn events. Stripe, for example, built live dashboards that track the global health of its payments infrastructure, not just for technical health, but business impact. That’s the difference between passive monitoring and business-aware analytics. Revenue, Risk, and Optimization BI stitches together what most organizations still treat as separate: Revenue insights: Who’s transacting the most? Which cohorts drive margin? User behavior: Which payment methods convert best by segment or region? Fraud detection: What anomalies are just edge cases - which are early signals? The best BI consultants bridge these questions in the same dashboard. They help risk teams build fraud scoring models without killing user experience via false declines. They help product teams understand which payment options are underperforming and why. They help revenue teams isolate profitable merchant tiers and optimize pricing. For companies like PayPal, these BI-driven insights directly inform which partnerships to prioritize, which UX flows to AB test, and which countries to double down on for growth.  BI Is the Compass Whether it’s Stripe expanding into new markets, or Square introducing BNPL features, those moves are backed by BI: What’s our volume by vertical in this region? What’s the fraud profile for the top 5 banks in the market? Can our infrastructure sustain another 100k users per day at current latency? BI teams provide the answers: in dashboards, in forecasts, in decision memos. They don’t just answer what’s happening. They model what’s next. Stripe’s internal BI team builds the metrics infrastructure that leadership runs the business on. They’re involved in product planning, operational readiness, and even feature deprecation, because everything touches the data. Lending Platforms (Digital Lending and BNPL) Credit Risk Isn’t Static From education history to bank cashflows, mobile phone usage to payroll APIs: the underwriting model is only as smart as the data behind it, and that’s where BI consultants come in. They surface correlations, test segment performance. They determine whether a borrower who scores 660 but has a recent college degree and three months of perfect neobank activity is a risk - an opportunity. Affirm’s entire underwriting model lives and dies by one question: what default rate are we accepting at this level of loan approval? BI teams track that in real time. The model may approve 70% of users, but if loss rates creep from 2.1% to 2.8%, someone has to catch it - and fast. That’s the job of BI.  Portfolios Need Radar Once loans are disbursed, it’s not just about waiting for repayment. It’s about active portfolio surveillance. Which cohorts are going sideways? Which geographies are softening? Is BNPL delinquency rising among Gen Z shoppers in fashion retail but not in travel? BI consultants power dashboards that answer these questions daily - by segmenting portfolio data across behavior, demographics, and payment patterns. Collections teams don’t blast everyone anymore. They target likely-to-cure segments first, based on repayment history and contact method effectiveness. That’s BI applied directly to recovery - turning analytics into dollars reclaimed. In many platforms, a 1–2% lift in collection rates across at-risk segments can unlock millions in preserved revenue. BI is how that happens. Growth That Pays for Itself Customer acquisition isn’t just a marketing function anymore, but it’s an analytical battlefield. CAC, drop-off rates, cost-per-funded-loan, funnel velocity - BI consultants run these models. And they’re not just measuring. They’re shaping targeting strategies. BI tells SoFi which ones bring good borrowers: high FICO, low churn, high cross-sell uptake. BI tells Upstart if a cleaner UX after A/B test of web pages increased completion from qualified users, not just more volume. Even pricing is analytics-driven. Want to bump conversion? Offer 1% lower APR, but only for segments with high predicted repayment likelihood. BI makes it possible to do that surgically, not by blunt discounting. This is where growth and risk get braided together, and BI is the unifier. Strategic BI Every lending decision has a downstream effect: risk, revenue, capital burn, regulatory exposure. And as markets fluctuate, capital costs shift, and borrower behaviors evolve: BI gives leadership the real-time radar to steer. You can’t afford to review performance quarterly. It has to be continuous recalibration. Upstart and Affirm are models of this in action. Their BI teams sit in daily standups with product, growth, and credit policy, pushing insights upstream into decision-making. When loss rates nudge, when default curves change, when new user behavior signals emerge, BI flags it before it shows up in charge-off reports. Insurtech (Insurance Technology Firms) CEOs leading insurtech ventures know that your value proposition is only as strong as your visibility into risk, claims, and customer behavior.  Pricing Risk is About Pattern Recognition Underwriting is the heart of the business. BI consultants here don’t just build dashboards. A BI-driven insurtech can analyze telematics, IoT feeds, weather models, historical claims, and demographic data, and then push it all into pricing models that can segment customers with precision. A user drives aggressively but only during the day? Adjust pricing accordingly. Claims spike in flood zones following two weeks of rainfall? Adjust exposure models in real time. A new cohort of Gen Z pet owners? Predict claims patterns before the actuaries catch up. This is where BI merges with predictive analytics.  Claims Are Where You Make (or Lose) Trust and Margin Claims management is where most insurers lose customer loyalty and money. It’s also where BI makes the biggest operational impact. BI dashboards monitor: Claim volume by region or cause Time to first contact, time to payout Approval vs. denial rates Anomalous behaviors or patterns that suggest fraud The key advantage? Proactive visibility. When a claims region is lagging, BI shows it. When a claim looks suspicious, BI flags it, not after the payout, but as it’s being processed. Lemonade has used this kind of data to deliver on its instant-payout promise, even as it scales.  From Mass Coverage to Micro-Personalization BI is also the engine behind product innovation. What riders are being added most? Which customer profiles are buying bundled coverage? Who’s likely to churn next quarter? This isn’t just CRM territory. It’s profitability intelligence: Which products deliver healthy loss ratios? Which customer segments drive margin vs. loss? Where can you push growth without spiking risk? Personalization in insurtech isn’t just a better quote flow. It’s using BI to match risk appetite with customer demand at scale. And BI doesn’t stop at customer insights. It drives capital allocation and regulatory posture. Whether it’s surfacing trends for board-level strategy or calculating reserve requirements for auditors - BI keeps the business compliant, informed, and agile. Lemonade: A Case Study in BI-Led Growth Lemonade didn’t just build an app. It built a BI platform that feeds product, pricing, marketing, and ops from a single source of truth. Their Looker-based system allows cross-functional teams to pull consistent KPIs, explore product performance, and spot new opportunities before competitors react. They didn’t guess at pet insurance or car insurance - they launched them based on customer data and BI-led opportunity mapping. That’s BI as product strategy - not back-office analytics. Wealthtech (Investment and Wealth Management Fintechs) AUM Is Not Just a Metric Your total assets under management (AUM) are the single biggest indicator of scale and trust. But AUM on its own is static. BI gives it motion: Where is AUM growing or shrinking: by cohort, by feature, by time of day? What’s the breakdown of recurring contributions vs. one-time deposits? How do performance returns compare against benchmarks and are users actually beating inflation? A strong BI layer doesn’t just report AUM. It explains it.  Betterment and Wealthfront are classic examples: they don’t just track daily balances. They correlate changes with user actions, product launches, or marketing campaigns. They know what’s driving growth, not just that it’s happening. Even trading spread revenue or advisory fees become BI artifacts. How much are you earning per user segment? Which services are most profitable per dollar of dev effort? Where is the cost-to-serve highest? In a market that’s increasingly margin-compressed, BI is your profitability microscope. Engagement Isn’t Just Retention Wealthtech lives and dies by active use. Inactive users don’t deposit. They don’t upgrade. They churn silently. BI helps you surface: Login and session patterns Feature interaction funnels Abandonment triggers (drop-off in funding flows or rebalancing features, etc.) You’re not just asking “how many users logged in today?” You’re asking: “which behaviors correlate with retention?” “Which feature launches actually move engagement?” “Where are people stalling in their first 30 days?” Wealthfront tracked how often users engaged with the app and used color-coded thresholds: green for healthy activity, yellow for drop-off, red for risk. Then they built features specifically aimed at improving those numbers. If your product roadmap isn’t shaped by this kind of BI telemetry, you’re iterating blind. You may be wasting dev cycles on features that look cool but don’t drive deposits or loyalty. Personalization Is the Monetization Engine All wealthtechs talk about personalized finance. Few deliver on it.  With the right BI systems, you can: Segment users by behavior, demographics, risk tolerance, financial goals Trigger personalized messaging, offers, or dashboard layouts Recommend the next best action: contribute, rebalance, upgrade A BI consultant might build a model that predicts which users are at risk of cashing out and trigger educational content or support follow-up before they go dark. Or you might run a segmentation analysis and discover that high-LTV users engage more with tax-loss harvesting tools, so you elevate that feature in the dashboard for similar users. Robinhood didn’t add crypto trading because someone had a hunch. They saw where user interest was spiking. BI flagged the signal, and the product followed. BI: From Compliance to Strategy in Real Time And then there’s the backend value: compliance. Regulatory reporting, audit trails, capital exposure - it all flows through the BI layer. The real upside is how BI aligns the whole business:   Product: “Which features actually move AUM?” Growth: “Which channels bring in the most profitable users?” Support: “Where are users stuck, and what’s causing ticket spikes?” Leadership: “Where should we invest headcount and capital next quarter?”   Betterment’s use of Looker dashboards to democratize visibility means every employee has access to real-time data. When everyone can see the score, everyone plays the game better. Blockchain/Crypto Firms BI as the Trading Floor Control Panel Crypto exchanges like Coinbase and Kraken operate more like infrastructure providers than traditional brokerages. Every second, they’re processing thousands of trades across dozens (or hundreds) of assets. BI consultants are the ones turning that firehose into intelligence. Key metrics tracked in real time: Volume by asset, trading pair, and region Liquidity and bid-ask spreads Order book depth and volatility Exchange fee revenue by customer segment Custodial asset value on-platform If trading volume on a specific token spikes, your infrastructure needs to scale. If liquidity dries up on a new pair, BI surfaces it before users feel it. If fees drop below profitability thresholds, BI raises the flag. And with on-chain activity now part of the data stack, BI teams even monitor blockchain inflows/outflows - spotting demand signals before they hit the platform. Your next most profitable trading pair? BI already saw it coming. Know Your Users - Or You’re Building for Ghosts Crypto platforms serve wildly different personas. The same interface may host: Passive holders checking price once a week High-frequency traders with custom APIs Users bridging tokens from L2s to mainnets NFT collectors Stakers and DeFi liquidity providers You can’t build one product for all of them. BI tells you who’s who - and what they want. At Coinbase, data analysts routinely cluster users by behavior — frequency, volume, asset mix, wallet age — and use those clusters to define roadmap priorities. New mobile features? Tailored for casual users. Advanced order types? Built for the top 5% of trading volume. This segmentation powers precision product strategy. Without it, you’re flying blind, building what you think users want — not what the data proves they’ll use. BI Is the First Line of Defense In crypto, the speed of fraud is fast. You don’t get weeks to detect patterns. You get minutes - if you’re lucky. BI teams in crypto companies are wired into: Anomaly detection ( sudden spike in withdrawals or trading from flagged IPs, etc.) Real-time exposure to volatile assets AML monitoring and suspicious activity pattern recognition KYC funnel conversion and identity risk scoring BI supports reporting, too — surfacing metrics for regulators, partners, and internal risk committees. Coinbase’s internal risk scores, lifetime value models, and fraud prediction systems are built off BI-led integrations between blockchain data, transaction logs, and user accounts. BI Isn’t just a Function  When Chainalysis decides which chains to support next, it’s not guessing. It’s analyzing: Market data demand User behavior across clients On-chain activity trends That’s BI, not product management alone. When Coinbase runs promotions or referral programs, they’re targeting users with modeled lifetime value curves — shaped by BI. In crypto, the feedback loop is faster, the cost of delay is higher, and the opportunity window is shorter. BI enables your team to react in time — or, more often, to act before the market moves. How Belitsoft Can Help Belitsoft is the technical partner fintechs call when they need BI that does more than visualize - BI that operates in real time, predicts what’s next, and supports business-critical decisions across risk, growth, and product. BI Consulting and Strategy Design Help fintech firms define KPI frameworks tailored to each segment: onboarding funnels for neobanks, fraud triggers for payment platforms, claim efficiency for insurtechs. Build BI roadmaps to connect siloed departments (product, risk, ops, marketing) through shared, actionable data. Custom BI Infrastructure Development Build data pipelines, ETL processes, and dashboards from scratch - using Looker, Power BI, Tableau, or open-source stacks. Integrate data from multiple sources (CRM, mobile apps, APIs, transaction logs, KYC systems) into a unified reporting platform. Behavioral Analytics & Predictive Modeling Implement machine learning models to predict churn, fraud, repayment likelihood, or upsell potential. Analyze user actions (logins, clicks, conversions, claims filed) to segment customers and drive retention or LTV. Embedded Analytics in Custom Fintech Platforms Build platforms with BI built-in — not just for internal reporting but to give users real-time views of their own data (AUM growth, spend insights, creditworthiness, etc.). Design admin dashboards for compliance, audit, or operational oversight. Risk, Compliance, and Regulatory Reporting Tools Automate report generation for audits, board meetings, and regulators. Ensure secure handling of sensitive financial/insurance data — complying with GDPR, HIPAA, PCI DSS, or other frameworks. Ongoing BI Operations and Support Offer BI-as-a-service: ongoing support for dashboard updates, data quality management, or metric tuning. Help internal teams become self-sufficient with data through training or embedded analysts. Partner with dedicated Power BI developers and BI consultants for fintech from Belitsoft who collaborate directly with your team. Our experts design secure, tailored analytics solutions, from Power BI dashboards to full-scale data systems, backed by deep technical and industry know-how. Contact for a consultation.
Alexander Suhov • 12 min read
Business Intelligence Consultant for Healthcare
Hospitals The average hospital generates terabytes of data every day - from EHRs, labs, pharmacy systems, billing systems, scheduling apps, and devices. Without BI, the data stays separate, slow to use, and not helpful when quick decisions are needed. BI consultants bring it together. They build dashboards for clinical staff, predictive models for risk managers, and workflow analytics for COOs. And increasingly, they’re sitting closer to the C-suite - not just reporting numbers, but highlighting what matters. Hospital systems, from top-tier academic centers to regional providers, are building dedicated BI departments.  Rely on our dedicated Power BI developers, experienced in building custom BI solutions tailored to clinical, financial, and operational needs. We help hospitals track the right KPIs, spot risks early, and make confident, data-driven decisions. BI Use Case #1: Better Care Hospitals can’t improve outcomes if they don’t know what’s going wrong, where, and with whom. BI teams monitor outcome KPIs: Readmission rates Post-op infection trends Discharge delays Clinical adherence gaps When BI is embedded in clinical teams, providers get alerts - not after the fact, but in time to act. One real-world case: hospitals using BI to flag sepsis early based on vitals and lab values — reducing ICU admissions and mortality rates. BI doesn’t replace clinicians but amplifies their vision. BI Use Case #2: Operational Efficiency BI consultants deliver performance insights on: Bed occupancy forecasting Nurse shift utilization Equipment downtime Patient flow bottlenecks Cleveland Clinic’s deployment of BI tools across operations is a gold standard: digitized workflows, integrated scheduling, and real-time resource tracking. The result? Fewer delays, less waste, better care. BI Use Case #3: Financial Visibility Healthcare finance is about seeing where revenue leaks, cost creeps, and margins disappear. BI dashboards surface: Revenue by service line Payer mix trends Length of stay vs. cost curves Denial rates and root causes The smartest CFOs use BI to answer questions faster: “Which DRG categories are underwater?” “Where are we losing revenue cycle velocity?” “How does staffing level affect case cost?” BI consultants don’t just help you measure the cost of care - they help you redesign it. BI Use Case #4: Compliance Healthcare is among the most regulated industries in the U.S. CMS, HIPAA, HEDIS, Joint Commission - the acronyms just keep coming. BI makes compliance predictable: Automated reporting to regulators Real-time privacy monitoring (unusual EHR access, etc.) Flags for missing documentation before audits occur Instead of scrambling when auditors arrive, hospitals with strong BI systems are already prepared, and logged. And when privacy breaches or billing errors are caught early? That’s BI saving reputation, not just revenue. Every large hospital system in the U.S. is now actively building analytics teams. The demand isn’t for domain-specific BI consultants who can work across: Epic/Cerner data models Claims systems Operational data from ERP and HR platformsHIPAA-aligned reporting frameworks In competitive health markets - especially value-based care regions - BI has shifted from innovation to necessity. Health Insurance Companies (Payers) Health insurers are becoming population health platforms, fraud monitors, and consumer engagement engines. The companies winning in 2025 are the ones with the sharpest visibility into cost, risk, and value. BI Use Case #1: Controlling Spend Healthcare costs are still rising. Wasteful utilization, unoptimized provider networks, and uncontrolled chronic conditions erode profitability daily. BI consultants are how insurers fight back  with math. BI teams analyze: Claims by cost driver, region, provider, or condition Patterns of overutilization (unnecessary imaging or ER visits, etc.) Projected future costs based on comorbidities, age, lifestyle, and geography When payers automate utilization management with BI, they flag the wrong services earlier. BI gives insurers the data to negotiate smarter contracts, with hard numbers behind every rate and benchmark. In a value-based care world, data is leverage. BI Use Case #2: Population Health The old model: react to illness, reimburse care. The new model: predict illness, prevent cost. BI is the bridge. Predictive analytics built by BI consultants can: Flag patients likely to be hospitalized within 12 months Identify populations trending toward costly conditions like diabetes or COPD Pinpoint care gaps by geography, provider, or demographic CMS star ratings, HEDIS scores, and ACA quality metrics are tied directly to financial performance and reimbursement. If your health plan can intervene early via a wellness campaign, a care manager phone call, or a targeted benefit - you lower spending and boost quality ratings. That’s margin expansion and market differentiation, powered by BI. BI Use Case #3: Fraud and Abuse In insurance, the fraud may be a pattern that looks plausible until you zoom out. That’s BI’s job. Advanced BI systems monitor: High-volume billers across time Duplicate or inflated claims Time-based logic (overlapping surgeries or implausible procedure schedules, etc.) Member usage anomalies Machine learning layered on top of BI platforms can score provider and member risk in real time - before the payout. Prevention beats recovery. This kind of proactive BI is both ROI-positive and a compliance win. BI Use Case #4: Personalization at Scale If your member experience still feels like a call center and a paper EOB, you’re going to lose to the next generation of digital-native plans. BI enables: Member segmentation based on health profile, engagement level, and benefit usage Targeted outreach for condition management, preventive screenings, and plan upgrades Product development tuned to real market needs (virtual care bundles for high-utilizers, etc.) Cigna’s “Health Advisor” wellness program is a perfect example. By mining member data, they identified who would benefit most from a health coach, prioritized outreach, and tracked the ROI in both satisfaction and downstream cost. This is retention science. BI Use Case #5: Compliance Star ratings, provider coverage, claims processing speed, and complaint handling - all of these reporting requirements need reliable, timely data. BI platforms automate: HEDIS and CMS measure tracking Denial rate reporting Claims aging and resolution summaries Audit logs and escalation flags BI lets you monitor your service quality in real time - from call center abandonment rates to claims processing times. That means you’re always audit-ready. Pharmaceutical and Life Sciences Companies Drug discovery, market strategy, regulatory compliance - every function now runs better with BI. Drug R&D: Turning Years into Quarters The cost of bringing a new drug to market still sits north of $1B. A lot of drugs still fail during development. BI helps by finding issues early and helping teams fix them faster. BI consultants in R&D work across: Clinical trial design - optimizing protocols using historical outcome data Real-time monitoring - spotting drop-off in recruitment or adverse events Trial performance analytics - comparing site efficacy, patient adherence, safety flags When Novartis invested in data lake infrastructure for its R&D arm, the intent was  faster iteration. BI makes it possible to adapt trial strategy while the trial is still in motion - saving time, dollars, and reputational risk. The result? Drugs move through phases with fewer surprises, and fewer delays. Manufacturing and Supply Chain When Pfizer partnered with AWS to deploy ML-powered BI tools on the factory floor, they were solving a problem: batch variability and quality control. BI systems help pharma manufacturers: Detect anomalies on the line - before defective batches are produced Optimize yield and machine uptime Forecast demand across global markets - and match production accordingly Monitor environmental data for compliance In an industry where a delay can derail national drug supply - or a single contaminated batch can trigger regulatory audits - BI is the difference between proactive control and expensive overreaction. At Merck, analytics-driven supply chain oversight improved on-time delivery rates and lowered operational overhead. BI helped operations and protected revenue. Commercial Strategy: Selling Smarter, Not Just More Pharma commercial teams are flooded with data — provider behavior, prescription trends, demographic shifts, campaign attribution.  BI consultants in commercial roles help answer: Which physicians are influencing prescribing trends in target geographies? What’s the ROI of our current drug marketing mix — by channel? Where is sales force activity misaligned with actual demand? Better BI enables precision sales: Tailored messaging by provider segment Optimized territory assignments Dynamic targeting based on real-time prescription activity BI isn't just showing where your sales are happening but where they should be. Compliance and Pharmacovigilance: BI Keeps You Out of the News In life sciences, regulatory risk is existential. FDA holds, label changes, or missed reporting deadlines can mean millions lost and years set back. BI platforms protect the enterprise by: Automating trial protocol compliance checks Surfacing adverse event trends post-launch Preparing standardized regulatory filings faster and with more accuracy Flagging quality issues before inspections Pharmacovigilance teams rely on BI to monitor global reports in real-time.  And from a governance standpoint, BI provides traceability and audit readiness - so when regulators ask “what did you know and when,” your team has the answer. Whether you're in drug discovery, clinical operations, manufacturing, or commercial, BI consultants are now embedded as strategic resources: Clinical data analysts supporting R&D velocity Supply chain BI architects driving predictive operations Market intelligence teams guiding brand launches and lifecycle management Compliance BI engineers ensuring regulatory readiness 24/7 Johnson & Johnson’s MedTech division hiring a Principal BI Consultant isn’t a one-off. BI is moving up the organization chart - into strategic planning, innovation councils, and executive dashboards. HealthTech Startups and Digital Health Companies HealthTech startups - ranging from digital health app makers and telemedicine providers to healthcare AI and analytics platforms - are another major source of demand for BI consultants.   BI Is the Feedback Loop Between Product and Patient Outcomes Most healthtech startups position themselves as outcomes-focused. You’re improving chronic care. Streamlining provider workflows. Reducing ER visits. But unless you can measure that impact, you’re just another well-designed app in a crowded App Store. BI gives you the feedback loop you need: Are patients using the tool as intended? Are outcomes improving across cohorts? Which features correlate with better results? A diabetes management platform, for example, is judged by changes in A1C, hospitalization rates, and care plan adherence. BI consultants build the dashboards that track those KPIs across thousands of users - and let your team iterate based on real impact. That’s what investors and enterprise customers expect in 2025: a line from product to health improvement, backed by live data. Startups live or die by resource efficiency. BI helps you: Identify your lowest CAC channels - and double down Monitor churn risk signals- and course-correct proactively Optimize clinician staffing - based on usage patterns and service bottlenecks Without these insights, you’re wasting ad dollars, burning cash on underused features, and missing key UX flaws. With BI in place? You’re making precision decisions: which A/B variant to ship, which referral program drives LTV, which user cohort needs a re-engagement campaign next week. Investors Don't Fund Claims BI is how you tell your story in numbers - not just in vision decks. Every enterprise client and every investor in healthcare asks: Does it work? Show me the data. Whether it’s: A 22% drop in readmissions A 14-day reduction in average diagnosis cycle A 3x increase in therapy adherence You can’t make those claims without BI capturing, validating, and packaging the evidence. And when those metrics show up in dashboards you can demo live? You’re selling proof at scale. Startups that don’t build this layer early either find themselves retrofitting analytics under pressure - which is always more expensive and less convincing. Even pre-Series A startups are hiring BI consultants as fractional experts to get dashboards running, define KPIs, and structure the first data pipelines. BI-Driven Startups Are the Product Some of the most successful startups in healthtech are analytics-first. Think: Komodo Health — turning national-level healthcare data into predictive signals Innovaccer — creating infrastructure for value-based care through real-time insights Clarify Health — offering BI tooling directly to providers and payers These companies don’t just use BI. They sell it. They hire BI consultants as product engineers. As client success partners. As platform architects. If your company plays in AI, clinical decision support, or population health intelligence — your entire roadmap is tied to the quality and flexibility of your BI foundation. Every funded healthtech startup is hiring BI roles right now - not just engineers, butthinkers who know healthcare workflows, regulatory nuance, and go-to-market data strategy. Why? Because they need to track usage and engagement in week one. Because they need to launch with compliance and reporting infrastructure already running. Because they need evidence of value before the next raise, not after. Founders that prioritize BI staffing now? They move faster. How Belitsoft Can Help Belitsoft helps healthcare organizations turn raw data into strategic decisions - by combining deep BI expertise with custom software development. Whether you're a hospital modernizing operations, a payer optimizing cost and risk, a pharma company running trials, or a healthtech startup proving impact - Belitsoft builds the tools that make your data work. What Belitsoft Can Offer Across Healthcare Sectors Hospitals and Health Systems Belitsoft can deliver: Custom BI dashboards for clinical staff, COOs, and risk managers, using EHR, pharmacy, lab, and device data. Real-time alert systems for events like sepsis risk, readmission, discharge delays. Predictive analytics for staffing optimization, patient flow, and equipment uptime. Integration services for Epic, Cerner, and other hospital systems into centralized BI platforms. Financial BI modules: denial tracking, DRG profitability, length of stay vs cost curves. As a custom development firm, Belitsoft can also build tailored modules on top of existing hospital IT infrastructure (augmenting BI in existing Cerner/Epic stacks with custom visualization or alerting tools, etc.). Health Insurance Companies (Payers) Belitsoft can offer: BI dashboards for claims analysis, population health trends, overutilization, and risk scoring. ML-assisted fraud detection tools (detecting anomalies, overlapping claims, inflated codes). HEDIS, CMS, and ACA reporting automation. Custom data pipelines that consolidate member engagement, claims, and provider behavior into one analytics layer. Member segmentation engines for targeted outreach, retention campaigns, and benefit design. Belitsoft’s strength is in stitching together data from disparate sources - legacy systems, call centers, digital tools - into one coherent BI engine. Pharmaceutical and Life Sciences Companies Belitsoft can provide: Trial analytics platforms: real-time monitoring, protocol optimization, patient adherence tracking. BI dashboards for manufacturing: predictive quality control, batch anomaly detection, equipment performance, supply chain forecasting. Commercial analytics systems: provider-level prescribing behavior, marketing attribution, sales team alignment. Compliance monitoring tools: tracking adverse events, trial deviations, and filing readiness. Data lake architecture & integration to support high-scale, multi-source analytics across R&D, supply chain, and commercial divisions. If a pharma company needs a Looker-like system with specific regulatory rules or integration with AWS/Microsoft stacks, Belitsoft can custom-build it. HealthTech Startups & Digital Health Belitsoft can support with: Early-stage BI architecture: setting up dashboards, defining KPIs, building pipelines for product/clinical/outcome tracking. Engagement and retention analytics for SaaS platforms (telemedicine, chronic care apps, etc.). Custom modules for A/B testing impact, clinician utilization, UX bottlenecks, re-engagement triggers. Real-time outcomes monitoring (A1C drops, diagnosis cycle time, readmission rates, etc.). Embedded analytics in client-facing tools (providers, payers) - product-grade BI. For data-first startups (like Innovaccer or Komodo), Belitsoft can serve as an outsourced product analytics team - building BI tools not just for internal use, but as part of the actual product offering.
Alexander Suhov • 9 min read
Business Intelligence Implementation
We transform your big data into rich data: dashboards and reports (Excel, Power BI, Web, etc) that are easy to use for making management decisions and get them working for your business. Our prebuilt reporting tools (for the C-Level, Sales Intelligence, Customer Intelligence, Marketing Intelligence, Financial Business intelligence, Supply Chain Intelligence, HR Business Intelligence, and other) let us speed up BI implementation. Talk to our BI implementation consultants BI Project Implementation Steps 1. BI Requirements Gathering, Resource and Funding Plan Do you have a detailed specification document for your new BI system?  This document will let you conduct a step-by-step check of your finished BI solution to see whether it conforms to your wishes at the beginning of the project. Besides, this is the only basis for understanding what your Resource and Funding Plan should be.   Which questions should the specification document answer?  Which employees would use the system? Which business processes that you need to digitize are they responsible for?  Which KPIs and metrics do you need to track in your BI reporting system?  If you don't have a detailed specification document for your new BI system we will provide you with a BI Business Analyst, who may work independently or in tandem with a BI consultant for healthcare or fintech, depending on your domain. These specialists understand the specific regulatory, operational, and performance nuances of your industry and will prepare such specification document for your needs. Our analyst maps out the business processes of your enterprise: He describes the connections between the business processes.  The document lists all the enterprise's functions and key stakeholders responsible for each of them, as well as KPIs and other measures for all the functions.  The resulting map becomes a foundation for the specification, as well as the framework for the future BI system, allowing the correct role-based access model to be developed (which employees will have access to what information) and letting the executives see the relations between the business-critical parameters. The specification is used as a foundation for a Resource and Funding Plan. It will show you:  Implementation steps; Implementation timeline; Implementation costs (human resource involvement on both your and our sides, and project budget). Tell us which core business processes do you need to control and we will provide you with an optimal set of well established KPIs specific to your business. 2. Design and Build a Data Warehouse for Business Intelligence Implementation We have started to implement your BI project.  The purpose of this step is to integrate different sources of your data (Databases, Flat Files, Marketing Analytics, Social Media, CRM/ERP, Helpdesks, etc.) into a single unified source - a so-called “Data Warehouse” database or set of databases.  Let us know which data sources do you need integrated with your BI solution?  Data Warehouse Implementation Steps 1. Developing the data storage structure of the Data Warehouse: which table to use for which kind of data (physical data structure). 2. Developing scripts for each data source to: a) Extract data from them; b) Check data for duplication and other errors, transform the data to fit the technical requirements of the Data Warehouse; c) Load the processed data in the Data Warehouse;  This step is called “ETL processes configuration” (ETL stands for “extract”, “transform” and “load”). 3. Tuning the Data Warehouse to conduct complex calculations - do the so-called “Data Enrichment configuration”. Why do you need this? a) If you need to add value to your existing data by using ABC(XYZ)-analysis, ranging, categorization, forecasting, modeling, etc., you need resource-intensive calculations.  b) You probably know what it’s like to see Excel freeze or stop working. One of the causes of these issues is trying to use Excel for calculating complex metrics, not just to visualize data. Using large amounts of data or complex formulas exacerbates this problem.   According to the best practices in BI development, complex data, including KPIs, should be calculated at the database level (backend) not the visualization tool level (frontend). This will ensure your business reports work quickly and reliably.  4. Connecting Data Warehouse database with OLAP Cube database.  Forming reports for your specialists based on the data stored in the Data Warehouse requires a dedicated developer manually writing database requests. This is, of course, unacceptable for a modern business, so you need to use one more technology - an OLAP Cube database.  For example, you need to create a multidimensional report. Your Data Warehouse has three tables: sales by date, sales by locations, sales by products.  To get a report about the amount of a certain product sold at a certain shop at a certain date the developer needs to write two requests to the Data Warehouse: about the sales on a certain date and about sales at a certain shop. And another request to consolidate the data. This looks inconvenient even at such a simple example. Yet after the OLAP Cube is prepared you don’t need a programmer for making multidimensional reports. Getting one only takes a standard Excel request. The OLAP Cube will do the heavy lifting, as it will have the necessary data and each sale would have the necessary dimensions (“date”, “shop”, “product”).  3. BI Data Visualization The previous steps let us creating the databases and making sure the data is correct. Now we need to work on the Dashboards, Scorecards, and Reports. This step brings you the interfaces that will be used by you or your employees daily. There are three kinds of interfaces: Dashboards with graphs, Scorecards, and Spreadsheet Reports  Dashboards The purpose of the dashboards is to show (even in real-time) the current state of the most important high-level metrics (both for specific processes and the business as a whole), the total indicators. Usually you can’t trace the cause-and-effect relationships here, but that isn’t the goal anyway. Graphs are often present.   Scorecards Scorecards - are a type of dashboards. The difference lies in their purpose. Scorecards demonstrate how the KPIs are being fulfilled (comparison with the planned results and showing deviations). This can be done for separate processes and the business as a whole.   Reports The reports are made to establish the cause-and-effect relationships and a structure within a specific process (the data is later summarised and used for dashboards).  The reports can be pre configured or easily and conveniently adapted by the users themselves without involving analysts, data scientists or IT specialists (self-service multidimensional reports).  4. BI Deployment  You can see the whole picture only after all the previous steps have been completed. Now you know that everything (both calculations and visualizations) works quickly enough (done within a few seconds) and don’t overstrain servers and user computers (so you don’t have to purchase any additional expensive equipment). This is also the time to decide on the optimal periodicity to automatically refresh your dashboards and reports. For example, IOT data needs to be updated in real-time (which leads to higher hardware requirements), but there is no reason to update the ABC-analysis data more often than once a month. 5. BI Security configuration  1. You would probably like to delineate the information access rights for the employees in different positions (e.g. they don’t need to know their co-workers’ salaries unless it is required as part of their duties). We prepare the role-based security that guarantees you flexible control (ease of adding/deleting new users and assigning rights).   2. We sign an NDA with you, providing you with legal protection of your data used over the course of the BI solution development and implementation.   6. BI Training We conduct a brief intensive training on tuning and using the system for different kinds of your users, including data engineers, business analysts, and business users.
Dmitry Baraishuk • 5 min read
Healthcare Business Intelligence
Our team of BI developers configures healthcare dashboards and reports for your organization by consolidating data from diverse sources. We offer implementation of Amazon QuickSight, Microsoft Power BI, Tableau, Google's Looker, Oracle, SAP, Sisense, and more. What is Business Intelligence in Healthcare? Healthcare business intelligence, as a subset of healthcare data analytics, takes historical health-related data from multiple internal and external sources and visualizes it multidimensionally. EHR/EMRs, labs, eHealth/mHealth apps and smart wearables, governmental agencies, accounting tools, and CRM platforms are among some of them. Data is saved, then analyzed, and finally reported. Cloud database development makes the process of healthcare data storage, data retrieval, and data analysis more efficient and secure. Using the information gained, it's possible to improve patient satisfaction and the financial performance of medical centers, clinics, hospitals, insurance vendors, research facilities, pharmaceutical companies, and data technology firms. Top Features to Look For in Healthcare Business Intelligence Software Security. User administration, platform access auditing, authentication management) Cloud-Readiness. The ability to build, deploy, and manage the BI software in the cloud across multi-cloud and hybrid cloud deployments. Data Source Connectivity. Enabling users to connect to and ingest data from various storage platforms, including on-premises and cloud. Supporting users to combine data from different sources using drag-and-drop. Data Preparation. Creating analytic models with user-defined measures, sets, groups, and hierarchies. Automated Insights, Natural Language Generation, and Data Storytelling. Applying machine learning to automatically generate insights and identify the most important attributes in a dataset. Automatically creating descriptions of insights in data that explain key findings or the meaning of charts or dashboards. Generating news-style data stories that combine headlines, narrative text, data visualizations, and audiovisual content based on ongoing monitoring of findings. Natural Language Searching. Enabling users to query data using terms typed into a search box or spoken. Data visualization. Supporting highly interactive dashboards and exploring data through manipulating chart images, including heat maps, tree maps, geographic maps, scatter plots, and other special-purpose visuals. Reporting. Providing parameterized, paginated, and pixel-perfect reports that can be scheduled and burst to a large user community. Top 7 Business Intelligence Software Tools for Healthcare With an emphasis on visual self-service, today's healthcare BI software incorporates AI and empower non-technical users to model and analyze data and share insights. Gartner lists Amazon QuickSight, Microsoft Power BI, Tableau, Google's Looker, Oracle, SAP and Sisense among top BI software providers. What possibilities do they bring to health-related companies? #1 Amazon QuickSight The key feature of Amazon's business intelligence tool, QuickSight, is a generative AI assistant named Q. It creates interactive visualizations, dashboards, reports, and customizable data stories on demand—without sending requests to the busy and overloaded BI team or waiting weeks or even months—simply by typing exact questions into the Q bar. Outputs include citations and references for transparency. API access allows integration of this capability into third-party applications. To make this business intelligence tool work, it should have access to your documents, images, files, and other application data, as well as structured data stored in databases and data warehouses. QuickSight connects with over 50 commonly used business tools and unstructured data sources (wikis, intranets, Atlassian, Gmail, Microsoft Exchange, Salesforce, ServiceNow, Slack, etc.). Get help with Implementing Amazon QuickSight #2 Microsoft Power BI Microsoft Power BI is a comprehensive data analytics tool available as a software-as-a-service option on Azure. It provides data preparation, visual data exploration, interactive dashboards, and augmented analytics. Power BI Premium includes AI-powered text, sentiment, and image analytics. Power BI seamlessly integrates with Office 365, including Microsoft Teams, Excel, and SharePoint. It can be enhanced by embedding Power Apps into its dashboards, and Power Automate flows can automate tasks based on the data. However, Power BI is limited to deployment on Azure and does not offer options for other cloud infrastructure as a service (IaaS). While data connectivity enables multi-cloud and hybrid cloud scenarios, governance of self-service usage is a common concern. On-premises Power BI Report Server has a more limited offering without features such as dashboards, streaming analytics, prebuilt content, natural language question and answer, automated insights, and alerting. To overcome the limitations of Power BI and use a more integrated analytics experience, as well as fully utilize their data infrastructure, organizations can transition to Microsoft Fabric. Belitsoft offers expert migration services to facilitate this shift, making the transition effortless for your workflows. Get help with Implementing Power BI #3 Tableau Tableau, a product from Salesforce, offers a user-friendly way to access, prepare, analyze, and present data. It empowers business users to explore visually their data with an intuitive drag-and-drop interface powered by the VizQL engine. Tableau provides a natural language query feature called Ask Data that can be integrated into a dashboard, and a data explanation tool called Explain Data. The vendor focuses on extending their natural language generation and data storytelling capabilities. Analysts can curate existing datasets using Lenses and access dashboard accelerators on the Tableau Exchange. The tool also offers centralized row-level security and virtual data connections. However, Tableau's licensing costs are relatively high, with additional fees required for features such as Data Management, Server Management, and Einstein Discovery. Some users report below-average satisfaction with Tableau's overall service and support, making it sometimes challenging to find Tableau-specific assistance. Get help with Implementing Tableau #4 Google’s BI software for healthcare Google's Looker is a cloud-based BI platform that provides users with self-service visualization and dashboard capabilities. It supports multi-cloud scenarios for deployment and database connectivity, with continuous integrations with other Google Cloud products like BigQuery. Looker's extension framework is a fully hosted development surface that allows developers to build data-driven applications. It offers direct query access to cloud databases, lakes, and applications as its primary data connectivity method. This enables users to leverage LookML's virtualized semantic layer without having to move their data. Google aims to open up the LookML data modeling layer to other BI platforms, including Microsoft Power BI, Tableau, and its own assets like Data Studio, Google Sheets, and Google Slides. Looker's APIs, software development kits, and extension framework, including the Data Dictionary, enable customers to create customer-facing applications and embed analytics in business workflows. The Looker Marketplace offers prebuilt data and machine-learning model Blocks to address common analytical patterns and sources. While Looker may have coding requirements compared to competitors' drag-and-drop data modeling and advanced analytics capabilities, it provides prebuilt data and ML model Blocks to mitigate this. However, Looker currently lacks augmented analytics features for automated insights, data storytelling, and Natural Language Generation, and its Natural Language Query interface is weaker compared to competitors. Get help with implementing Google's Business Intelligence software #5 Oracle Healthcare BI Oracle offers a comprehensive BI cloud solution that includes infrastructure, data management, and analytics applications. With data centers in 30 regions, Oracle supports customers' multicloud needs through an open architecture approach. Oracle focuses on conversational user experiences and automated data storytelling features. These include generating audio podcasts that highlight key trends, data changes, outliers, and contextualized insights. Users can benefit from Natural language queries in 28 languages and Oracle Analytics Day by Day for mobile devices. For on-premises deployments, Oracle offers Oracle Analytics Server, and for Oracle Cloud Applications, prebuilt analytics solutions are available through Fusion Analytics Warehouse. The Oracle warehouse provides native integration for Oracle's ERP, human capital management, supply chain, and NetSuite products. Although Oracle Analytics Cloud can access any data source, its packaged analytic applications (Fusion Analytics Warehouse and NetSuite Analytics Warehouse) are designed specifically for Oracle enterprise applications. Non-Oracle application customers would need to build their own applications using Oracle Analytics Cloud to gain similar capabilities. It's worth noting that customers have reported below-average satisfaction with Oracle's service and support. Additionally, the legacy Oracle Healthcare Foundation (OHF) analytics solution is no longer actively supported. Get help with implementing Oracle Healthcare Business Intelligence software #6 SAP Healthcare BI SAP Analytics Cloud is a cloud-based platform that integrates with SAP cloud applications and can query both cloud and on-premises SAP resources, such as SAP Business Warehouse, for live data. Its user-friendly Story Viewer and Story Designer tools enable non-technical users to create and interact with dashboards and reports. The Analytics Designer, a low-code development environment, facilitates the creation of analytics applications using APIs. SAP Analytics Cloud stands out with its integrated functionality for planning, analysis, and prediction. It offers "what-if" analysis, change tracking, and calculation capabilities. The platform also includes strong functionality for natural language generation, natural language processing, and automated insights. Its integrated functionality for planning, analysis, and prediction sets it apart from other platforms. For the healthcare industry and related lines of business, SAP Analytics Cloud provides pre-built business content, including data models, data stories, and visualizations. However, it is primarily utilized by existing SAP business application customers and legacy business intelligence users. Customers without a SAP-centric application or data ecosystem typically do not opt for SAP Analytics Cloud. While SAP Analytics Cloud is a cloud-native platform that can query on-premises data, customers seeking an on-premises deployment would need to use a standalone SAP BusinessObjects BI to fully leverage the analytics catalog functionality and Universe connector for a complete hybrid deployment experience. Get help with implementing SAP Healthcare Business Intelligence software #7 Sisense Healthcare BI Sisense is a self-service analytics platform that offers advanced analytics and application development capabilities. Many users utilize Sisense in its OEM form. Sisense Fusion focuses on integrating analytics into business workflows, providing interactive visualizations and natural language query capabilities. It offers a microservices-based architecture that is fully extensible, allowing for embedding analytics into applications and workflows. Sisense Notebooks serve as a bridge between data professionals and self-service users who want to perform advanced analysis using SQL, Python, R, and other programming languages. Infusion Apps provide users with prebuilt examples for Google Chrome, Google Sheets, Google Slides, Microsoft Teams, Salesforce, and Slack, helping to tie analytics to actions. Sisense Fusion is cloud-agnostic and multicloud-capable, with deep partnerships with AWS, Google Cloud, and Microsoft, as well as strong cross-cloud analytics orchestration. Sisense's analytics marketplace is a one-stop shop for publishing and building analytics artifacts, including connectors, applications, and workflows. Sisense can catalog other analytic vendors' assets via APIs, and it offers extensible connectivity to other reporting tools. Developers can utilize the Extense Framework to create custom applications or workflows or choose from prebuilt Infusion Apps for embedding analytic capabilities. However, customers have reported below-average evaluations of third-party resources, such as integrators and service providers, as well as the overall quality of the peer user community. Sisense's service and technical support have also received below-average evaluations. Get help with implementing Sisense Healthcare Business Intelligence software We work with B2B healthtech companies to help their clients make better use of healthcare information. Our developers create custom healthcare software based on their requests. Shortlist our company as your potential partner that has an available pool of talented data analysts and BI consultants for healthcare who can solve any business intelligence challenge by developing, customizing, and implementing complex analytics solutions. Benefits of Business Intelligence and analytics for healthcare organizations BI Consolidates Health Data and Protects It Business intelligence in healthcare is about consolidating clinical, administrative, and financial data. It works even with previously loosely-related systems. But it goes beyond that. Business intelligence tools allow one to protect sensitive patient information. Access to different parts of this data is easily restricted to comply with HIPAA law and more. BI Improves Decision-Making Business intelligence is a holistic visualization of all the KPIs you're tracking. It connects to multiple data sources to put the information into a single, centralized repository - a data warehouse. BI reports and dashboards answer the question "What happened?", and "Why did it happen?" can be explored with drill-down analysis. BI predictive analytics is based on data scientists' calculations. It's often more justified than personal opinions. Machine learning and statistics are unbiased ways to understand "What can we expect as a result?" Simulation and scenario analysis make clear "What actions should we take?" BI Reduces Healthcare Costs Business intelligence can quickly interpret large and complicated data like bills, medical records, and financial statements and provide useful information in a few hours instead of days. Coming from the research on clinical activities, supplies, logistics, costs, and outcomes, a BI helps turn data into timely resolutions. It links and puts together huge amounts of data from providers, life sciences organizations, and insurers to find cost savings, trends, and optimal treatments and medications. With quick situational insights, unexpected challenges can be mitigated, and resources can be used more efficiently. By leveraging built-in AI capabilities, it is possible to predict and plan for future needs. Avoid Costly Readmissions BI software highlights the patients with a certain condition who are readmitted within, for example, 30 days of discharge. It determines the factors contributing to these readmissions, for example, medication non-adherence. Steps to address them may involve providing patients with better education and support to ensure they take their medication correctly or improving follow-up care after discharge. Prevent Chronic Patients From Complications Business Intelligence systems identify the patients with a certain condition are at risk for complications, like foot ulcers or kidney disease. Taking action on these cases in the initial stages leads to more targeted interventions and prevents high expenditures on developed complications. It may concern mostly medication management, acting as reminders for drug refills or pill organizers to help patients stay on track with their treatment regimen. Or it aligns remote monitoring programs that include wearable devices to track blood glucose or blood pressure levels and send alerts to healthcare providers if the levels are outside of the target range. Optimize Healthcare Supply Chain Management In the healthcare sector, supply costs are considerably high. However, leveraging data analysis BI tools holds great potential to bring down these costs. With healthcare supply chain analytics, you can identify and forecast variations in demand or potential supply disturbances, quickly recognize and address supply chain problems, and prevent or ease shortages of medical supplies and drugs. Through monitoring inventory levels and expiration dates, then evaluating usage patterns, it minimizes waste by pinpointing areas where overstocking is taking place and adjusting inventory levels accordingly. Improved Patient Treatment Building a data-driven approach in healthcare propels this domain forward, as 94% of healthcare stakeholders believe. They emphasized the top advantage doctors and patients can leverage from implementing healthcare BI tools and data analytics: a more personalized treatment path. Dmitry Baraishuk Chief Innovation Officer at Belitsoft on Forbes.com Predicting Surgical Complications Healthcare BI tools with predictive analytics can determine a patient's risk of post-surgical complications, such as kidney failure and stroke. It should develop a special model collaboration with a multidisciplinary team comprising a surgeon, cardiologists, nephrologists, and other specialists. This predictive model determines which patients were likely to suffer a stroke, cardiac event, or die within 30 days of surgery. Health-related providers can use it at a patient's bedside to conduct pre-surgery assessments. Clinicians inform surgeons of potential risks and better advise patients, resulting in improved care delivery. Identify Patterns and Trends in Patient Health Outcomes The organization uses BI tools to analyze data from electronic health records: patient demographics, medical history, and treatment outcomes. Healthcare providers commit a notice. For instance, the patients with a particular condition are experiencing longer hospital stays and higher rates of readmission compared to patients with the same case at other hospitals. The Business Intelligence team works with the hospital staff to examine potential causes, like delays in diagnostic testing, longer wait times for specialty consultations, and slower medication reconciliation processes. After they operate the data to implement targeted interventions, such as optimizing the order of diagnostic tests, reducing wait times for specialty consultations, and streamlining the medication reconciliation process. Because of this interference, the hospital improves better patient outcomes. Limitations of Healthcare Business Intelligence Data entry, management, interpretation, and sharing can often rely on manual processes, which are prone to errors, particularly in the healthcare industry. Without a coherent system of accountability in place, these errors can accumulate and lead to further complications. Healthcare data is a complex and heterogeneous collection originating from various sources and takes many forms. This includes patient profiles, healthcare provider information, pharmaceutical company data, disease registries, diagnostic tests, treatment options, and various types of visual data, such as scans, images, and graphs. The above databases are constantly growing as new admission, diagnostic, treatment, and they add medical records on discharge. The diverse nature of these data sources presents significant challenges with aggregating and integrating the data, constructing a data warehouse, and loading the data into a rules-based engine for generating actionable insights and reports. Reliable Health Business Intelligence depends on accurate data access. Thus, prior to introducing a BI solution, it is vital to configure robust data management. Healthcare Business Intelligence Analyst A skilled BI analyst is essential, especially during the initial configuration of healthcare BI software and self-service tools. Their primary responsibility is to customize data models and dashboards to align with the unique needs of a health-related organization. Business Intelligence Analysts work with company data to identify areas for improvement in current processes and establish metrics or KPIs to track product performance and identify areas of improvement. These analysts possess strong data visualization skills to present their findings in a clear and understandable format to stakeholders. The role of a Business Intelligence Analyst extends beyond reporting. They assist businesses in uncovering insights by asking the right questions and exploring data. BI analysts help to guide organizations to discover new knowledge and find answers to unanticipated questions. To achieve this, BI specialists use a range of tools, including web analytics tools, database tools, ETL tools, and full-stack BI platforms like Power BI or Tableau. Requirements often include: Experience in health informatics and healthcare analytics Ability to analyze data and communicate insights through dashboards and reports Strong SQL programming and advanced data manipulation skills Experience building data products using business intelligence software Familiarity with healthcare data sources, such as claims, electronic health records, and patient-reported data Detail-oriented with a focus on producing accurate and polished work Excellent written and oral communication skills The specific responsibilities of a BI analyst vary depending on the company's needs. Example 1: Devoted Health was seeking a Sales Operations BI Analyst who could work with complex data, communicate insights through data visualization, and prioritize data governance. The ideal candidate would collaborate closely with various teams within the company, including business, data science, product management, analytics engineering, data engineering, and software engineering. Example 2: McLaren Health Care network was in search of a BI analyst to handle healthcare claims and quality data reporting, analytics, and statistical analysis. The ideal candidate would have a strong understanding of healthcare data, including cost of care and patient utilization metrics. Experience in healthcare analysis, including statistical methods, data mining, forecasting, simulation, and predictive modeling, was also required. Example 3: Aledade sought a Business Intelligence Data Analyst to provide continuous analytical support, using operational and clinical data to address pressing business questions, support data operations, and project management functions. This role would be a part of the Business Intelligence team. In each case, the analyst's responsibilities varied, such as: collecting and integrating health plan and internal systems data creating data visualization solutions examining trends, providing actionable insights, and supporting stakeholders with operational and clinical data analysis Other key responsibilities of the Data Analyst included: Developing actionable roadmaps for workflows and processes Setting up and organizing KPIs and timelines for deliverables aligned with team objectives Building interactive dashboards, reports, and data visualizations to effectively communicate insights from data and drive action Assisting in the design and implementation of data warehouse tables or views to support analysis and reporting Supporting the team in research, data analysis, meeting preparation, follow-through, and the development of strategies to address health disparities Proactively identifying and flagging major risks or challenges to draw attention, allocate resources, or implement mitigation steps Example 4: Franciscan Health was seeking a Healthcare Business Data Analyst with the following functions: Identifying and proposing evaluation strategies for key performance indicators (KPIs), quality metrics, outcomes, population management studies, and other relevant areas Developing technical and functional specifications based on business requirements and workflow analysis Managing database processing functions, such as merge/purge, data hygiene, data appends, and coordination with business partners Identifying and addressing data quality issues that may affect reporting, such as duplicate records or missing data Utilizing appropriate programming languages and technologies to extract and process data for business analytics Identifying effective methods of data visualization and presentation to communicate project findings to management Tracking and analyzing trends and relevant measures to maximize database capabilities Integrating add-on programs to optimize back-end processes Acting as a liaison between the analytical needs of departments and business partners Business Intelligence Dashboards for Healthcare Healthcare dashboards allow healthcare organizations, including providers and payers, to gain deeper insights into their data by drilling into trends and Key Performance Indicators (KPIs) related to patients, providers, operational departments, clinical records, and finance. A healthcare dashboard offers users a real-time graphical display of their healthcare KPIs. It enables medical institutions to measure and compare metrics, such as patient satisfaction, physician allocation, Emergency Department Wait Times, and occupied bed count. This tool aids in improving operational efficiency, resulting in better outcomes and more intelligent decisions. Executive KPI Dashboard Many measures are now publicly reported, many of which are directly linked to reimbursement and are critical. It's challenging to prioritize what to work on next and respond to constantly changing needs while having fixed resources to improve patient experience, reduce the cost of care, and improve population health. The Executive KPI Dashboard quickly displays critical KPIs. It is vital to understand the performance clearly and focus the efforts on where it's possible to maximize returns. This dashboard accelerates information sharing and provides a scaffolding to automate the collection of critical data elements and unify analytics across multiple platforms. The Executive KPI Dashboard accomplishes this by using a consistent, simple, and easy-to-understand visualization of the most critical measures. A quick glance at the dashboard shows the state of dozens of KPIs, including the number on each bar, performance against the benchmark, trend over time, and most recent performance. Users can drill down to a linked dashboard to learn more or access reference material, such as an internal wiki page. Additionally, users can view performance through a statistical process control chart, with signals for particular cause variations automatically highlighted. Executive KPI Dashboard. Tableau Hospital Performance Dashboards The department can monitor a hospital's admissions, comparing the number of doctors and average wait time. Such monitoring can facilitate determining the necessary resources required to run each department. Additionally, tracking patient satisfaction provides a means to measure both the performance of doctors and the overall quality of each division. Establishing a relationship between the user and the dimension allows control over which divisions are visible to which users due to security reasons. Hospital Performance Dashboards. Sisense Dashboards for Patient No-Show Data Analysis and Prediction One common issue in outpatient practices is patient no-shows and late cancellations, which lead to decreased revenue for the practice, and longer wait times for other patients. Our aim is to increase patient attendance and reduce last-minute cancellations, to make more patients being seen by healthcare providers. We could use analytics to predict when patients may not show up or cancel at the last minute, allowing us to take a proactive approach to reduce these occurrences. To achieve this goal, we need to identify the breakdown of appointments by various patient characteristics, and then predict which patients are more likely to cancel, and schedule appointments accordingly. As a simple prevention measure, we can also implement tailored appointment reminders. Additionally, using run charts can provide valuable information about attendance trends and fluctuations over time, helping to further refine our predictive models and intervention strategies. Insurance Claims Dashboards To maintain profitability, insurance companies must continuously monitor the claims made under their various policies. This allows them to modify premiums for policies with chief claims ratios or introduce new policies to reduce premiums for their clients. Additionally, identifying the number of claims per customer or policy can help insurers offer cost-effective premiums that benefit both the customers and the company. The insurance analytics dashboard plays a critical role in achieving these objectives. Hire healthcare BI analyst Get Help with Implementing Business Intelligence Software
Dmitry Baraishuk • 15 min read

Our Clients' Feedback

zensai
technicolor
crismon
berkeley
hathway
howcast
fraunhofer
apollomatrix
key2know
regenmed
moblers
showcast
ticken
Next slide
Let's Talk Business
Do you have a software development project to implement? We have people to work on it. We will be glad to answer all your questions as well as estimate any project of yours. Use the form below to describe the project and we will get in touch with you within 1 business day.
Contact form
We will process your personal data as described in the privacy notice
This site is protected by reCAPTCHA and the Google Privacy Policy and Terms of Service apply
Call us

USA +1 (917) 410-57-57

UK +44 (20) 3318-18-53

Email us

[email protected]

to top