Get your own data-rich cost-effective Business Intelligence (BI) products that fits your unique business processes and includes all the necessary KPIs.
Quickly derive meaningful insights out of your raw data from all the necessary sources, using a single business intelligence data warehouse (DWH).
Predict trends, be informed on any potential business challenges and make well-informed decisions.
We have developed and successfully implemented BI solutions for standard business processes fitting your industry, department, or business function.
Contact us to learn more

Our BI Solutions
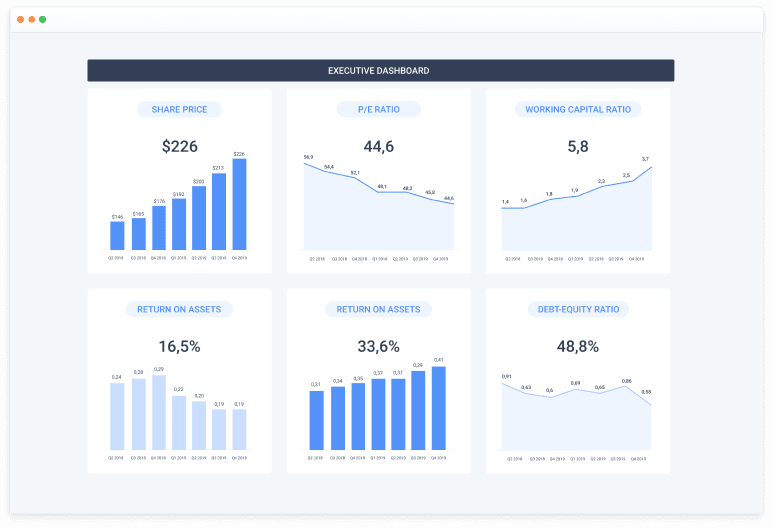
Dashboard for Executives
Executives can track all company-level KPIs, aggregated and visualized in one place, for a quick review of performance—for example, of each department like Finance (Gross Profit Margin, EBITDA, Accounts Receivable, and Payable) and Sales (Revenue, Opportunity Pipeline).
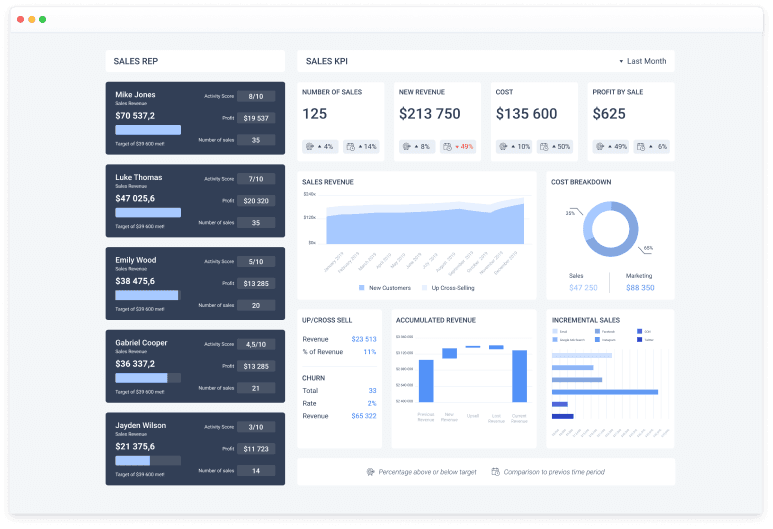
Sales Analytics Solution
For in-depth sales analytics with details in time periods, channels, customers, nomenclature, divisions, managers, suppliers, documents, lots, etc.
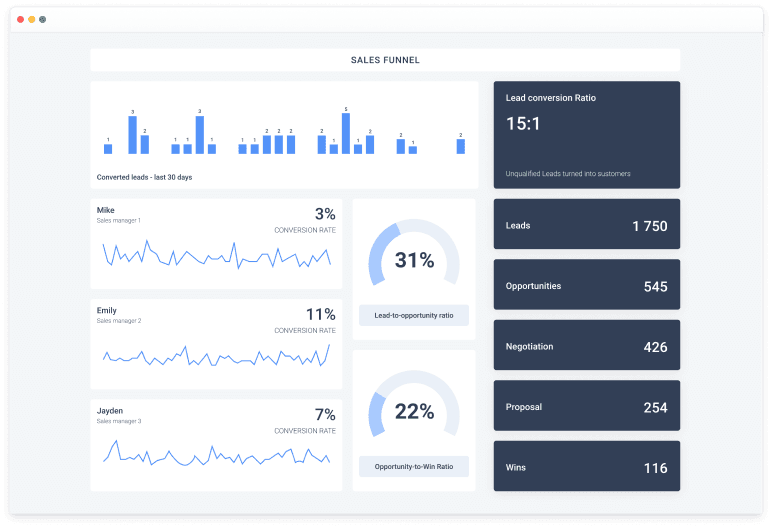
Customer Analytics Solution
Allows you to monitor all relevant customer KPIs and manage the customer base. Provides for the possibility of segmentation and analysis by channels, customers, sales funnel.
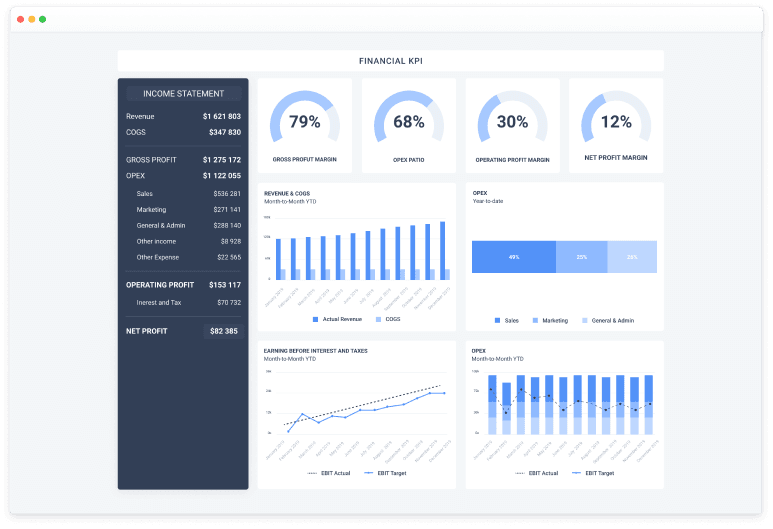
Financial Analytics Solution
Allows you to make sales and budget forecasting (by sales channels, assortment structure, cost structure), analyze the financial indicators (cost, discounts, margins, profits, etc.) and generate standard financial reports (P&L, CF, BS, etc.)
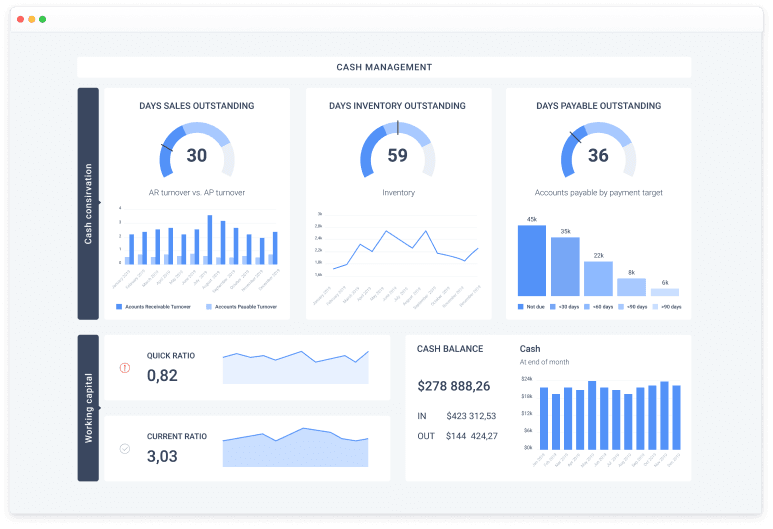
Accounts Receivable & Cash-flow Analytics Solution
With in-depth analysis of cash-flow and receivables detailed by types and categories of debts, amounts and terms of debts, the ratio of normal and overdue receivables, receivables turnover, etc.
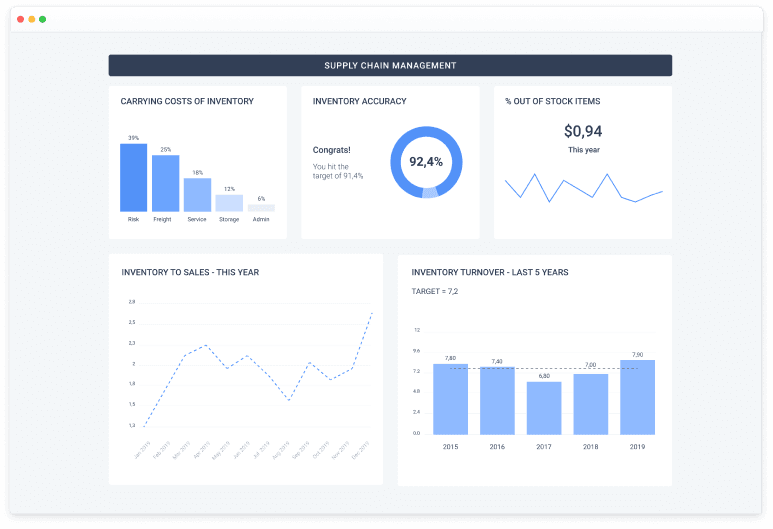
Supply Chain Analytics Solution
Supply Chain Analytics Solution (Vendors, Logistics, Inventory) with in-depth analysis of supply chain and inventories: cost, illiquid assets and goods with expiration dates; turnover, average balances in days of sales; insurance stocks and stock shortages.
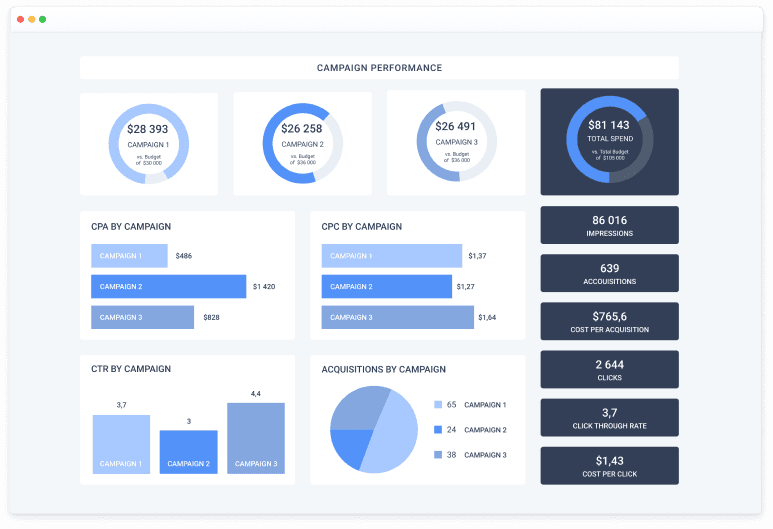
Marketing Analytics Solution
Created to analyze the effectiveness and further development of the marketing function in the organization. The analysis is carried out through promotion channels and events in relation to commercial and financial indicators.
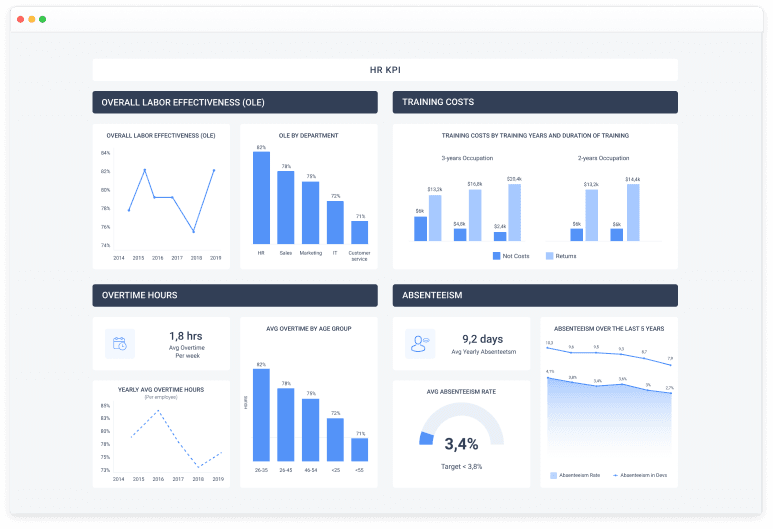
HR Analytics Solution
HR Analytics Solution allows you to plan, select, hire, and motivate staff. In-depth analysis of motivation, salary, staff turnover, the effectiveness of training procedures, etc.
Analytics Solutions by Industry
Help you to enrich your analytics with all the necessary specific industry KPIs
Manufacturing & CPG Analytics
Supply Chain & Logistic Analytics
Marketing & Advertising Analytics
Distribution, Retail, E-commerce Analytics
Travel & Hospitality Analytics
Education Analytics
Software & IT Services Analytics
Healthcare Analytics
BFSI (Banking, Finance, Insurance) Analytics
Healthcare Business Intelligence Solutions
Healthcare Business Intelligence transforms raw healthcare data into actionable insights to enhance healthcare service efficiency and patient care. These solutions are typically implemented through Business Intelligence software, data visualization software, and analytics platforms.
EHR Business Intelligence. Business Intelligence enables healthcare providers quickly analyze and interpret both structured and unstructured data within an Electronic Health Record system. Once a patient's data is entered, immediate analysis is possible, expediting the diagnosis and treatment process.
Healthcare CRM Analytics. This tool allows providers to monitor patient compliance with care plans, identify those lagging, and schedule necessary follow-ups. With our CRM analytics solution, insurers can examine utilization trends to enhance operational efficiency and identify at-risk members neglecting care plans. Medical device firms can identify critical account patterns and proactively engage with clients at high risk of churn. Meanwhile, sales managers can assess their teams' performance.
Pharmacy Business Intelligence. Data analytics enhances store performance assessment, aids in identifying prescriptions due to refill, and categorizes them based on profitability. This strategy can highlight regular patients who haven't visited recently or those with unfilled prescriptions. Proactive outreach, guided by these analytics, can improve patient adherence. Moreover, discerning drugs sold at a loss is key to efficient inventory management and sustaining profitability.
Healthcare IOT Analytics. A unified business intelligence and data analytics platform capable of handling data from diverse medical devices across various manufacturers, overcoming the challenge of non-standardized data structures. The synergy of BI, IoT, and aggregated data across large patient groups uncovers trends and insights. These findings can guide effective treatment strategies and lifestyle management decisions for specific individuals or broader patient groups, such as those with diabetes. IoT data, sourced from health monitors to telematics, also aids insurance companies in reducing risk and promoting premium savings for customers.
Business Intelligence in Transportation Industry

BI and Data Warehouse consulting services

DWH, ETL, OLAP Design and Implementation
Get a single data warehouse with the necessary databases tailored to the analytical needs of your team and based on your existing technology landscape.
Get the preconfigured automated ETL processes to eliminate the necessity of using human resources for the routine tasks connected with extraction and data mining, data quality assurance, and processing of various types of data from multiple sources and storing them into the data warehouse.
Enrich your data with measures and dimensions that aren’t included in the initial data sets but are required for advanced analytical tasks such as ABC(XYZ)-analysis, ranging, categorization, forecasting, modeling, etc.
Get an OLAP database (OLAP cube) - the powerful online reporting and visualization analytical processing system optimized for the fast generation of multidimensional reports by using pre-calculated and pre-aggregated data.
Media
ETL - Real Time
Data Marts
Warehouse Core
Primary data
OLAP — Dashboards
BI Reporting & Visualization
Power BI Services

Hire Power BI developers at Belitsoft to transform raw data into meaningful and actionable information, empowering better decision-making and driving business growth.
BI Performance Tuning

Not happy with the performance of an implemented BI solution? You need BI performance tuning for every phase of the BI lifecycle.
We are here to help you with:
You get the highly performant and scalable BI solution that reduces the time for creating complex reports and visualizations and runs as fast as possible.
BI Security implementation

Be assured that sensitive information from your BI solution is protected from hackers, leaks, and thieves.
With the role-based security, your BI solution will offer different levels of access to users, depending on whether you want to allow them to view all the dashboards/reports, or just some of them, to create dashboard/reports, and so on.
BI Features
Request a custom price quote for your BI System. Use the Features list below
to describe the
project and we will get in touch with you within 1 business day.
Portfolio
.jpg)
.jpg)
.jpg)
.jpg)
.jpg)
.jpg)

Recommended posts
.jpg)
.jpg)
.jpg)
.jpg)
.jpg)
.jpg)
Our Clients' Feedback


Belitsoft has been the driving force behind several of our software development projects within the last few years. This company demonstrates high professionalism in their work approach. They have continuously proved to be ready to go the extra mile. We are very happy with Belitsoft, and in a position to strongly recommend them for software development and support as a most reliable and fully transparent partner focused on long term business relationships.

Global Head of Commercial Development L&D at Technicolor
They use their knowledge and skills to program the product, and then completed a series of quality assurance tests. We were working in an agile way with them. Belitsoft performed very well throughout our project. We are definitely looking at Belitsoft as a long-term partner.

Service Delivery Director at Crimson (United Kingdom)
I highly recommend Belitsoft for website design and development. We were up against a tight deadline to launch the project. The work was delivered on time and within budget! I will continue working with Belitsoft as a valued partner for our web development!

Program Administrator at UC Berkeley (United States)
We have worked with Belitsoft team over the past few years on projects involving much customized programming work. They are knowledgeable and are able to complete tasks on schedule, meeting our technical requirements. We would recommend them to anyone who is in need of custom programming work.

Main Partner at Hathway Tech (United States)
Belitsoft company is able to make changes instantly. One of our internal engineers has commented about how clean their code is. Belitsoft seems to know what they're doing, which I appreciate.

Co-Founder at HOWCAST MEDIA (United States)
It was a great pleasure working with Belitsoft software development company. New requirements and adjustments were implemented fast and precisely. We can recommend Belitsoft and are looking forward to start a follow-up project.

Head of Division at Fraunhofer FIT (Germany)
Belitsoft company has been able to provide senior developers with the skills to support back end, native mobile and web applications. We continue today to augment our existing staff with great developers from Belitsoft.

CEO at Apollo Matrix (United States)
Belitsoft company delivered dedicated development team for our products, and technical specialists for our clients' custom development needs. We highly recommend to use this company if you want the same benefits.

Managing Director at Key2Know A/S in 2012 (Denmark)
We approached BelITsoft with a concept, and they were able to convert it into a multi-platform software solution. Their team members are skilled, agile and attached to their work, all of which paid dividends as our software grew in complexity.

COO at Regenerative Medicine LLC (United States)
Having worked with Belitsoft as a service provider, I must say that I'm very pleased with the company's policy. Belitsoft guarantees first-class service through efficient management, great expertise, and a systematic approach to business. I would strongly recommend Belitsoft's services to anyone wanting to get the right IT products in the right place at the right time.

CEO at Moblers
If you are looking for a true partnership Belitsoft company might be the best choice for you. They have proven to be most reliable, polite and professional. The team managed to adapt to changing requirements and to provide me with best solutions. I strongly recommend Belisoft.

Director at ShowCast Limited (Germany)
I expected and demanded a lot of you at Belitsoft company, but you exceeded my expectations. You acted pro-actively, challenged me at the right moments. Thanks!"

CEO at Ticken B.V. (Netherlands)
We have been working for over 10 years and they have become our long-term technology partner. Any software development, programming, or design needs we have had, Belitsoft company has always been able to handle this for us.
Founder from ZensAI (Microsoft)/ formerly Elearningforce