We develop analytic solutions that go beyond the standard reporting features found in commercial CRM applications. Our services include building predictive models, bespoke customer segmentation algorithms, and custom dashboards tailored to individual client needs. To predict customer behavior, recommend personalized products, and optimize campaigns, we incorporate AI and machine learning in CRM data analysis. Our solutions provide real-time insights into customer behavior and market trends. These systems notify businesses about upselling or cross-selling chances in real-time when a customer is about to churn, offering immediate suggestions for action.
Analytical CRM Goals
The first step before developing an analytical CRM is to answer the question: 'What is expected from the analysis?'
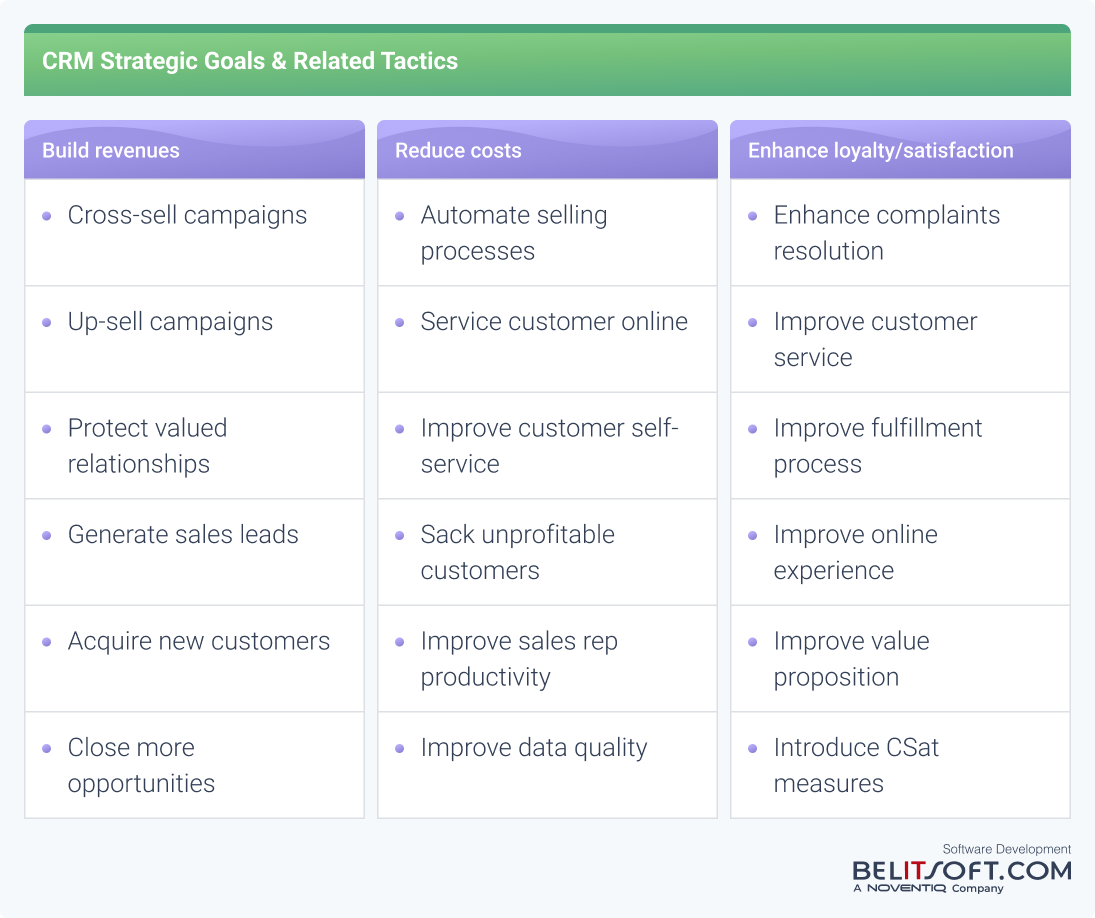
Analytical CRM, or analytic CRM, can provide insights on customers with the highest lifetime value, those at risk of switching to competitors, and the best next offer. With data analytics tools, a company can create more effective cross-selling, up-selling, customer retention, and acquisition programs.
CRM databases help marketing teams find signals indicating potential customer churn. By analyzing these patterns, they can target retention offers to customers at risk, proactively keeping their valuable customer base.
Companies may identify highly satisfied customers and promote tailored offers, capitalizing on their positive experiences to drive repeat sales.
Website personalization is a strong suit of CRM databases. Organizations that use CRM analytics see lower cancellation rates thanks to personalized campaigns. E-commerce platforms can analyze customer browsing behavior and purchase patterns to dynamically recommend the "next best offer" as customers navigate the site. Personalized product recommendations increase the likelihood of conversions.
Our custom CRM development services simplify operations and enhance productivity. With over 20 years of experience, Belitsoft offers tailored database solutions to enhance business interactions and customer relations. Whether you need a fully customized platform or modifications to an existing CRM, we adapt our services to meet your unique requirements. Contact us for a consultation.
CRM Databases
CRM Analytics relies on customer-related data from corporate databases like purchase history, payment history, campaign responses, loyalty scheme data. It can be augmented with additional information from external business intelligence organizations or social media, such as geo-demographic/lifestyle data.
CRM databases serve as the central repository for all customer data. The effectiveness of CRM data analytics depends on the quality, comprehensiveness, and organization of the data within these databases.
Structured Data
Most corporate databases store data in a structured format with a fixed structure. Each field holds specific data, such as customer name, address, purchase history, etc. Records contain multiple related fields based on the data model.
Commercial CRM applications come with pre-defined data models for different industries. For example, the data model for a banking CRM would differ from a life sciences CRM.
Users can't modify the core data model but can add fields.
Structured data is common in corporate databases used by sales, marketing, service, logistics, and accounts departments. Third-party sources provide structured data, including market research firms and credit scoring agencies.
Unstructured Data
Unstructured data does not follow a predefined model. It includes text files like emails and customer feedback, as well as documents, presentations, handwritten agent notes on phone conversations, recorded calls, images, and videos.
The amount of unstructured data generated by social media users has significantly increased. This exponential growth of unstructured data from diverse sources has led to the term "big data". CRM practitioners can already utilize certain big data technologies, such as voice recognition, predictive analytics, social media monitoring, and text analytics.
Our services are oriented towards integrating a broader array of both structured and unstructured data from various sources into the CRM. Your system will be capable of pulling in data from IoT devices and social media, among other sources, creating a 360-degree view of the customer. We enhance data quality, completeness, and cleanliness within CRM systems. This involves data cleaning, de-duplication services, or enriching the data.
Relational Databases
Relational databases are the standard architecture for CRM applications that use structured data. They store data in tables with rows and columns, similar to a spreadsheet. Each table holds information on a specific topic, such as customers, products, transactions, or service requests.
Each record (row) in a relational database has a unique identification called the primary key. For example, in a sales database, each customer has a unique number that serves as the primary key.
Companies often have multiple databases for marketing, service, inventory, and payments. The primary key for each customer is used to connect data across these databases.
Data Warehousing and CRM
Companies operating globally generate massive amounts of customer data from various sources. To convert this data into actionable information, data warehouses are used.
These warehouses store large volumes of operational, historical, and customer-related data, often exceeding terabyte or even petabyte levels.
Building a data warehouse involves several steps:
- Identifying relevant data sources
- Extracting data from those sources
- Transforming the data into a standardized and clean format
- Uploading the transformed data into the warehouse
- Regularly refreshing the data
Retailers, home shopping companies, and banks have been enthusiastic adopters of data warehouses to consolidate and analyze their customer data.
CRM Data Mart
A data mart is a subset of a larger enterprise data warehouse that is tailored to the needs of a specific department. For example, marketing and sales departments can have their own dedicated data marts that contain only the relevant CRM-related data.
Salespeople can use it to determine revenue and profitability by customer, product, region, or sales channel. They can analyze call response rates and times. Partner managers can compare marketing fund approvals to partner-generated revenues and assess each partner's performance.
Implementing data marts is less complex than a full data warehouse project, as they involve less data, fewer users, and a more precise business focus. Due to their smaller scale and scope, data mart projects tend to have lower costs compared to enterprise-wide data warehousing initiatives. The technology infrastructure required for data marts is less demanding, making them more accessible for departmental use.
We develop data warehousing solutions as per the clients' requirements. They improve data analysis without disrupting operational data.
OLTP/OLAP Models
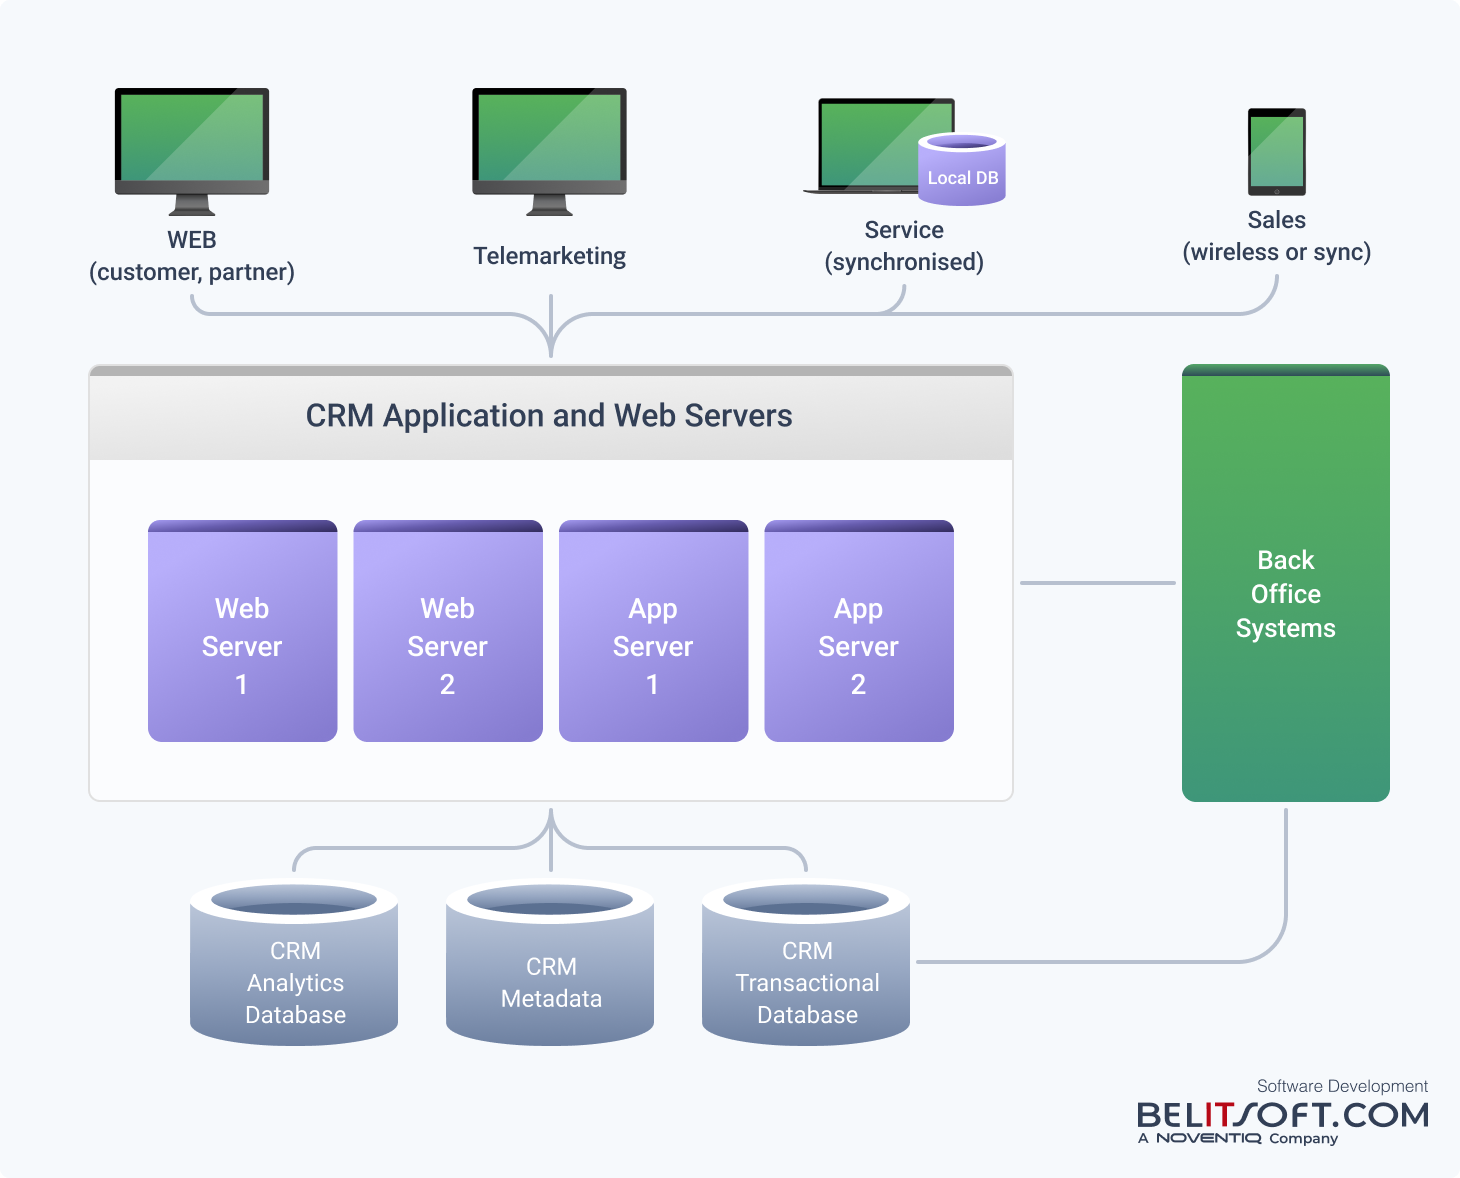
Customer data is divided into two subsets: operational data and analytical data.
Operational data resides in Online Transaction Processing (OLTP) layer, designed to handle day-to-day transactional data processing, such as customer orders, payments, and account updates.
On the other hand, analytical data is stored in an Online Analytical Processing (OLAP) layer, optimized for data analysis and reporting purposes. The information in the OLAP layers is a summarized extract or subset of the data from the OLTP layer, or a consolidated view of data from multiple sources, containing only the necessary information for analytical tasks.
This optimization allows for data storage and processing for analytical queries and reporting, enabling complex data analysis, like trend analysis, forecasting, and data mining.
Online analytical processing (OLAP)
OLAP technologies aid in data analysis with slice-and-dice, drill-down, and roll-up processes.
Slice-and-Dice
This process allows us to view data from different perspectives. For example, a salesperson could "slice" the data by region (e.g., North America) and "dice" it by a specific product to analyze the sales performance of that product in that region.
Drill-Down
The drill-down process starts from a summary view of data and goes into more detailed levels. For example, a sales manager can start by looking at the total sales revenue for the company. Then, they can drill down to see revenues by country, state, and individual salespersons or stores within a state.
Roll-Up
Roll-up is the opposite of drill-down. For instance, sales data can be rolled up from individual transactions to daily, monthly, and quarterly sales.
OLAP is used to analyze data stored in a star schema. A data warehouse integrates multiple star schemas for different analytical subjects, like customers, opportunities, service requests, and activities.
Star Schema
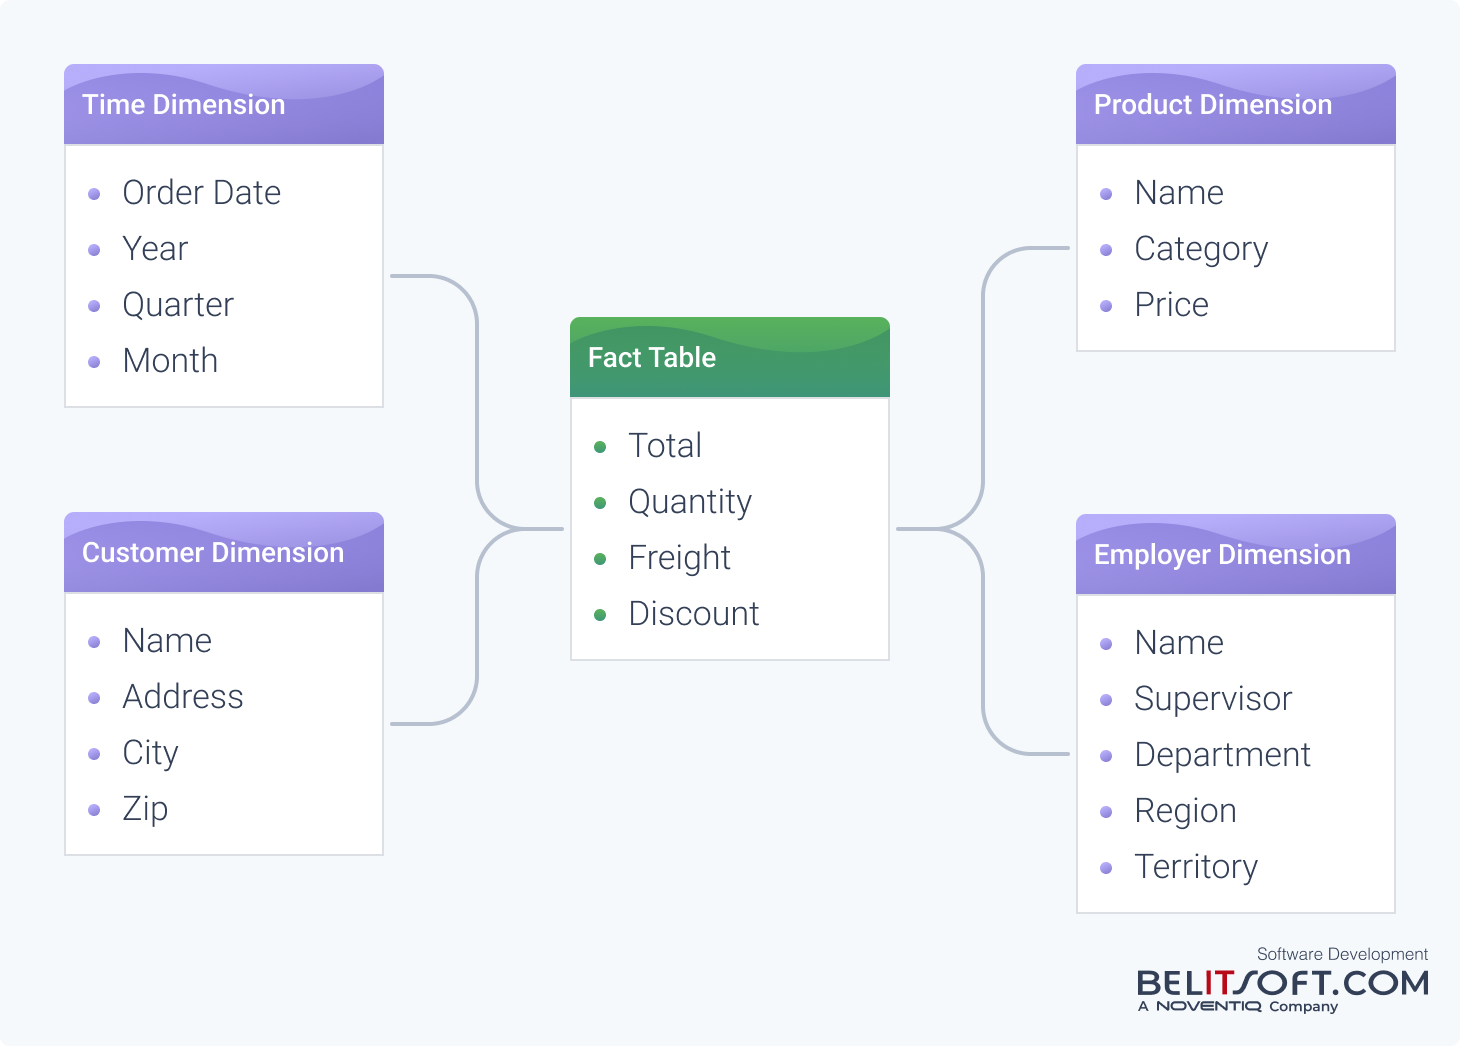
A star schema is a type of database schema that is optimized for data warehousing and OLAP applications. It gets its name from its resemblance to a star, with a central fact table surrounded by dimension tables.
Fact Table
The fact table is the core of the star schema and stores quantitative data (or "facts"), such as sales revenues and volumes. For instance, in customer-focused schema, the fact table would contain metrics like sales revenue, sales volumes, cost of sales, profit margins, discounts, and promotional expenses.
Dimension Tables
Surrounding the fact table are dimension tables, which contain descriptive attributes related to the facts. The attributes (or "dimensions") are perspectives through which the facts can be analyzed. Examples of dimensions include geography, time period, customer, and product class. In the customer schema, dimension tables could include customer demographics, geographic locations, time periods, and product categories.
Disaggregation and Analysis
Facts can be disaggregated and analyzed through various dimensions. To illustrate, sales revenues can be segmented based on geography (country, state, city) and time (year, month, day). This helps understand sales performance across different locations and periods.
Hierarchical Dimensions
Dimensions often have a hierarchical structure, allowing for detailed analysis at various levels. In the geography dimension, one can analyze data at the country level and then drill down to states and cities for more granular insights.
Questions Answered by OLAP Using Star Schema
With a star schema and OLAP, users can address a wide range of business inquiries:
- What discounts are available to this customer?
- How do the quantities shipped or sales figures change annually?
- What are the total sales for a particular product?
OLAP also enables users to explore data and understand the reasons behind certain metrics' performance. In the case of lower-than-expected sales in the UK, users can investigate the data more extensively by analyzing geography, time, or product class, giving them the opportunity to identify potential causes.
The business analytics market features numerous providers that deliver OLAP capabilities. Key players include Tableau, Qlik, Microsoft, IBM, SAS, SAP, and Oracle.
For a US-based digital health company, we developed a custom CRM database to enhance patient recruitment and retention for clinical trials. This solution improved patient engagement and trial outcomes by simplifying the process and providing advanced analytics. Get in touch for guidance.
Data enrichment (ETL/AI/ML)
Data enrichment involves adding extra measures or dimensions to enhance the existing data, allowing for generating forecasts using data mining techniques on the raw statistical data stored in the database. Techniques like classification, prediction, and clustering can segment customers, anticipate their needs, and personalize their experiences. This approach, which relies on data marts and warehouses, strengthens customer relationships and drives success within CRM strategies.
Description
One goal of analytics is to understand complex data. Descriptive analytics cut through the noise within millions of customer records, revealing trends and patterns. This simplified view of "what's going on" provides a starting point to realize the reasons behind customer actions.
Classification
Analytics also help in making informed decisions about new prospects. By classifying customers based on factors like customer lifetime value (CLV) and creating profiles for each group, you can quickly assess where a new customer might fit. This insight allows for tailored approaches and personalized interactions from the very beginning.
Classification is like sorting items into distinct groups. Think of it like categories such as "likely to buy", "unlikely to buy", or "high-value customer". Customer classification based on their response likelihood to a new credit card offer is one way banks may segment their clientele.
Estimation
When dealing with estimation, the numbers involved can span a broad spectrum. The focus shifts from categorization to making accurate predictions of specific values, such as a customer's spending potential or the probability of them leaving (churning). The bank's marketing campaign probably utilizes a prediction model to assign a score (ranging from 0 to 1) to each customer, indicating their likelihood of responding positively.
Prediction
Prediction in CRM means forecasting customer actions through either classification or estimation. Curious about who will recommend a friend, increase their spending, or upgrade? Predictive models examine past data where these activities have taken place, creating patterns that can predict future behavior.
Affinity grouping
Affinity grouping helps businesses understand the hidden connections within customer purchases. In retail, this involves examining shopping carts to identify frequently purchased items. This reveals potential cross-selling opportunities and informs store layouts. The Walmart example of diapers and beer on Fridays illustrates this strategy's effectiveness in boosting sales.
Clustering
Clustering transforms customer data into actionable segments. Instead of forcing customers into predefined categories, it analyzes their behaviors and characteristics to reveal naturally occurring groups. These clusters should contain members who are very similar to each other, yet distinct from members of other clusters. CRM practitioners can use this insight for targeted marketing, customized experiences, and even understanding factors behind customer complaints. Once formed, these clusters are given descriptive labels like "Young Professionals" or "Rich people in the suburbs" to easily understand their characteristics.
Directed and undirected data mining
Directed data mining aims to predict specific outcomes (customer response, churn likelihood, etc.) using historical data as a guide. Classification, prediction, and estimation are the key tools here.
The goal of undirected data mining is to uncover hidden patterns and relationships within the data itself without a specific target outcome in mind. Clustering and affinity grouping techniques help identify these patterns.
Data mining procedures
Decision trees turn complex data into simple decision paths. They use a series of questions to make predictions. Each question is based on a specific factor and helps split the data into smaller groups. Consider the scenario of predicting customer turnover - the decision tree would pose inquiries such as "How long has the customer been with us?" or "What is their recent spending trend?". These questions lead to smaller and smaller groups and ultimately predict the likelihood of a customer leaving.
Logistic regression
Logistic regression is a powerful tool for understanding customer behavior. It goes beyond basic data analysis by considering factors like phone ownership time and social media usage. It predicts specific actions that customers are likely to take, such as upgrading or churning. The results provide probabilities for each customer's engagement in that behavior. CRM teams can use these probabilities to personalize offers and improve the success of their campaigns.
Multiple regression
When predicting customer spending, multiple regression analyzes multiple factors, including income and purchase frequency. It determines which factors have the greatest impact on spending amounts. This helps focus efforts on the factors that are most important.
Discriminant analysis (DA) clusters
This tool creates groups based on similarities. It helps identify patterns that differentiate "big spenders" from "budget shoppers". New customers can be assigned to groups using discriminant analysis.
Neural networks
Neural networks are powerful for prediction, even with complex, messy data. They can uncover hidden patterns and interactions. Picture them as a highly versatile brain that gains knowledge from vast amounts of data. However, they can be difficult to understand. They are best used when accurate results matter more than understanding the inner workings of the model.
Hierarchical clustering
Hierarchical clustering breaks down complex customer data into manageable groups. It is flexible and allows analysts to choose the level of detail they need. Imagine grouping export markets based on sales patterns. The hierarchical model can reveal both larger regions (like Northern Europe) with similar sales trends and smaller clusters with specific buying habits. This helps tailor strategies for each group and maximize the impact of CRM efforts.
K-means clustering
K-means clustering is a popular tool for organizing data into groups. You choose the number of clusters you want (that's the "k") and the algorithm finds optimal groups that are tightly packed together but well-separated from other groups. Analysts often experiment with different values of "k" to uncover useful groupings. Once the clusters are formed, the clusters are analyzed and labeled for easier understanding and use in CRM.
Two-step clustering
Two-step clustering helps make sense of extensive customer databases. It quickly breaks down complex data into smaller, more manageable chunks and uncovers patterns within each group. This is useful when you have mixed customer information, like demographics and purchase history. These insights can power targeted CRM strategies.
Factor analysis
Factor analysis reveals hidden connections between individual data points, grouping them into a smaller number of underlying factors. This is valuable when you have many variables to analyze. It uncovers core factors, simplifying large datasets for better comprehension and usability.
Imagine a company wants to improve customer satisfaction. They conduct a survey with many questions covering various aspects of the customer's experience. Instead of looking at each answer separately, factor analysis is used to find patterns. The results might show that customer satisfaction is driven by a few key things, like "product reliability" and "customer service responsiveness." The company can then focus on these core areas to improve overall customer satisfaction more effectively.
CRM Data Visualization via Reporting
Reporting in CRM analytics offers valuable insights into sales, customer behavior, and market trends.
Reports can be displayed as tables, charts, graphs, maps, dashboards, and can be exported to other applications for further analysis.
CRM Reporting can be divided into two main types: standardized reports and query-based (ad hoc) reports.
Standard Reports
Standardized reports are predefined and often come as a built-in feature within CRM software. These reports can focus on performance against quota, sales rep/call center activity or, list key accounts and annual revenues. They are generated on a regular schedule (daily, weekly, monthly) to provide a consistent view of certain metrics over time.
Standard reports may have limited customization options, such as date ranges, specific products, or geographic regions. While standardized reports are quick and easy to generate, their usefulness is limited to what the report designers anticipated. Organizations may find that standard reports may not always address unique questions.
Query-based Reports
Query-based reporting, also known as ad hoc reporting, is a flexible approach to data analysis. It allows users to create specific reports based on their role. For example, a report could be generated to identify customers in a specific territory with expired maintenance agreements and annual revenues above $100,000.
Explore how Belitsoft modernized a US healthcare company's system by developing a cloud-native web app on AWS, integrating BI and CRM functionalities. This helped to improve patient relationships and streamline healthcare processes. Connect with us to enable your data-driven decisions.

Rate this article
Recommended posts
.jpg)
.jpg)
.jpg)
.jpg)
.jpg)
.jpg)
.jpg)
.jpg)
.jpg)
.jpg)
.jpg)
.jpg)
.jpg)
Portfolio
.jpg)
.jpg)
.jpg)
.jpg)
Our Clients' Feedback


Belitsoft has been the driving force behind several of our software development projects within the last few years. This company demonstrates high professionalism in their work approach. They have continuously proved to be ready to go the extra mile. We are very happy with Belitsoft, and in a position to strongly recommend them for software development and support as a most reliable and fully transparent partner focused on long term business relationships.

Global Head of Commercial Development L&D at Technicolor
They use their knowledge and skills to program the product, and then completed a series of quality assurance tests. We were working in an agile way with them. Belitsoft performed very well throughout our project. We are definitely looking at Belitsoft as a long-term partner.

Service Delivery Director at Crimson (United Kingdom)
I highly recommend Belitsoft for website design and development. We were up against a tight deadline to launch the project. The work was delivered on time and within budget! I will continue working with Belitsoft as a valued partner for our web development!

Program Administrator at UC Berkeley (United States)
We have worked with Belitsoft team over the past few years on projects involving much customized programming work. They are knowledgeable and are able to complete tasks on schedule, meeting our technical requirements. We would recommend them to anyone who is in need of custom programming work.

Main Partner at Hathway Tech (United States)
Belitsoft company is able to make changes instantly. One of our internal engineers has commented about how clean their code is. Belitsoft seems to know what they're doing, which I appreciate.

Co-Founder at HOWCAST MEDIA (United States)
It was a great pleasure working with Belitsoft software development company. New requirements and adjustments were implemented fast and precisely. We can recommend Belitsoft and are looking forward to start a follow-up project.

Head of Division at Fraunhofer FIT (Germany)
Belitsoft company has been able to provide senior developers with the skills to support back end, native mobile and web applications. We continue today to augment our existing staff with great developers from Belitsoft.

CEO at Apollo Matrix (United States)
Belitsoft company delivered dedicated development team for our products, and technical specialists for our clients' custom development needs. We highly recommend to use this company if you want the same benefits.

Managing Director at Key2Know A/S in 2012 (Denmark)
We approached BelITsoft with a concept, and they were able to convert it into a multi-platform software solution. Their team members are skilled, agile and attached to their work, all of which paid dividends as our software grew in complexity.

COO at Regenerative Medicine LLC (United States)
Having worked with Belitsoft as a service provider, I must say that I'm very pleased with the company's policy. Belitsoft guarantees first-class service through efficient management, great expertise, and a systematic approach to business. I would strongly recommend Belitsoft's services to anyone wanting to get the right IT products in the right place at the right time.

CEO at Moblers
If you are looking for a true partnership Belitsoft company might be the best choice for you. They have proven to be most reliable, polite and professional. The team managed to adapt to changing requirements and to provide me with best solutions. I strongly recommend Belisoft.

Director at ShowCast Limited (Germany)
I expected and demanded a lot of you at Belitsoft company, but you exceeded my expectations. You acted pro-actively, challenged me at the right moments. Thanks!"

CEO at Ticken B.V. (Netherlands)
We have been working for over 10 years and they have become our long-term technology partner. Any software development, programming, or design needs we have had, Belitsoft company has always been able to handle this for us.
Founder from ZensAI (Microsoft)/ formerly Elearningforce