It's not a trivial task to transform electronic health records into insights. Data scientists have to extract suitable data from the system, clean it of errors and inconsistencies that always exist, and finally use appropriate statistical and machine learning methods to achieve the main goals. These goals come from healthcare domain experts and may sound like "improve patient care."
Before Extration
To host and manage healthcare data for analytical purposes, a separate healthcare analytics database is needed. The raw EHR database data should be converted, preferably adopting the OMOP Common Data Model, to enable systematic analysis with standard analytic tools.
Raw EHR databases are usually optimized for fast data entry and retrieval of individual patient records, not for complex analysis. Creating a separate database specifically for analysis can improve query speed and reduce the load on your operational EHR system.
Database system development includes database design, implementation, and database maintenance.
Healthcare analytics database design
Conceptual Data Model
This is an abstract representation of the data and connections between distinct entities (such as patients, visits, medications) without being tied to a particular database system.
Specification of a logical schema
The logical schema defines each table needed in your database, like "Patient", "Medication", "Diagnosis". It includes Columns (or fields/attributes) that determine what information goes into each table, such as patient name and date of birth). The Datatypes of the columns, like text, numbers, or dates, are also specified, along with any Constraints like Primary Key - a unique identifier for each row in a table, such as patient ID.
Healthcare analytics database implementation
This involves creating the actual database based on the logical schema. Examples include optimizing data storage for better performance, implementing security measures to safeguard data, and establishing user interactions with specific data segments.
Healthcare analytics database maintenance
This entails ensuring the database continues to perform well and adapt to changing needs. Monitoring performance and addressing issues, making changes to the structure as needed, effective communication between healthcare database administrators, developers, and users to determine necessary changes.
Our healthcare software development services handle complex challenges of healthcare data analytics, ranging from data extraction to the application of advanced statistical and machine learning techniques. Contact our experts for deeper data insights.
Difference between EMR and EHR data
Electronic medical records (EMRs) digitize the traditional paper charts found within a specific hospital, clinic, or doctor's office.
Electronic health records (EHRs) are much more comprehensive, as they include all the data found in EMRs as well as information from labs, specialists, nursing homes, and other providers. EHR systems share this data across authorized clinicians, caregivers, and even patients themselves, allowing for coordinated, patient-centered care regardless of location. Besides patient care, EHR data serves administrative and billing purposes.
Recently, EHRs have become a major source of real-world evidence, aiding in treatment evaluation, diagnosis improvement, drug safety, disease prediction, and personalized medicine.
We collaborated with a US healthcare solutions provider to integrate EHR with advanced data analytics capabilities. Our integration streamlined data management, empowered healthcare providers, and optimized care delivery processes, resulting in improved patient outcomes and operational efficiency. Check out our case to learn more.
The complexity of EHR data demands a multidisciplinary team to handle the challenges at every stage, from data extraction and cleaning to analysis. This team should comprise experts in database, computer science/informatics, statistics, data science, clinicians, epidemiologists, and those familiar with EHR systems and data entry procedures. The large volume of EHR data also causes significant investment in high-performance computing and storage.
For more information on effectively leveraging EHR data and healthcare analytics, explore our comprehensive guide on EHR Implementation.
Improve patient care and streamline operations with our EHR/EMR software development. From seamless data integration to intuitive user interfaces, our team of dedicated healthcare app developers can tailor to your needs. Get in touch for project planning and preliminary research.
Traditional Relational Database Systems
EHR data often fits well into the table format (patients, diagnoses, medications, etc.). Relational models easily define how different entities link together (a patient has multiple visits, each visit has lab results, etc.). Constraints offered by relational databases help maintain data accuracy.
Oracle, Microsoft SQL Server, MySQL, and PostgreSQL are widely used relational databases in healthcare.
Distributed Database Systems
As databases grow massively, traditional systems struggle with performance, especially for analysis and complex queries.
Apache Hadoop: The Framework
Hadoop lets you spread both storage and computation across a cluster of commodity (regular) computers. The Hadoop Distributed File System can reliably store massive amounts of data on multiple machines. It also offers a programming model for breaking down large-scale analysis tasks into smaller parallel chunks.
Apache HBase: The Real-Time, Scalable Database
Apache HBase, on the other hand, uses HDFS for storage and is a non-relational database. It is designed to handle semi-structured or unstructured data, borrowing principles from Google's Bigtable solution for managing massive datasets. It enables fast retrieval and updates on huge datasets.
NoSQL (like HBase, MongoDB, Cassandra DB) vs. Traditional SQL Databases
NoSQL databases excel at handling images, videos, and text documents that don't fit neatly into predefined tables. They store data as "documents" (similar to JSON), providing flexibility in the structure of information stored in a single record. However, NoSQL databases prioritize horizontal scalability (adding more machines to store more data) and may sacrifice some consistency guarantees compared to traditional SQL databases.
Data Extraction in Healthcare
Inclusion/exclusion criteria may consider patient demographics like age, gender, or race. It can also involve extracting data from various tables in EHR/EMR systems, such as medication, procedure, lab test, clinical event, vital sign, or microbiology tables. However, some of these data or variables may have high uncertainty, missing values, or errors.
To aid, Natural Language Processing (NLP) techniques can be employed. NLP can analyze text data within EHR/EMR systems to identify relevant mentions that may not be directly linked to expected keywords or codes but are important for analytics purposes.
Moreover, accurately identifying missing relationships based on indirect evidence requires substantial domain knowledge.
Cohort Identification
Cohort identification selects patients to analyze based on diagnoses, procedures, or symptoms.
Careful definition of the cohort is essential to avoid mixing patients who are too different. Without a well-defined cohort, the analysis will not yield useful insights about any group.
Identifying your research cohort in EHR data can be tricky due to input errors, biased billing codes, and missing data.
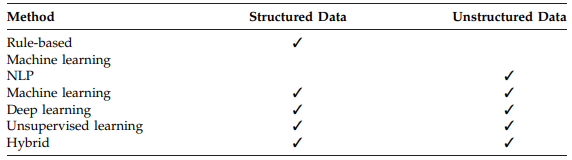
Rule-Based Methods for Cohort Identification
ICD codes are a starting point for identifying patients. When studying conditions like heart attacks (acute myocardial infarction), it may seem logical to search for ICD codes specifically linked to that diagnosis.
However, relying solely on ICD codes, especially for complex diseases, is often not sufficient. It is important to note that ICD codes are primarily used for billing. Doctors may choose codes that are more likely to get reimbursed, rather than the code that precisely reflects a patient's complex condition. The condition's severity, complications, and management are important factors not easily represented by one code. Errors in data entry or delayed diagnoses can lead to patients having incorrect codes or missing codes.
Machine Learning Methods for Cohort Identification
Machine learning algorithms can be trained to spot patterns in complex EHR data that may go unnoticed by humans, potentially finding patients that traditional rules might overlook.
Clinical notes contain detailed patient information that is not easily organized into codes. NLP techniques help computers understand human language within these notes.
Key Tools and Methods
- MedEx. A specialized NLP system designed to extract medication names, dosages, frequencies, and other relevant information.
- CLAMP. A broader toolkit that supports various NLP tasks in the medical domain, like identifying diagnoses or medical procedures within the text.
- OHNLP. A resource hub providing researchers with access to a variety of NLP tools, thereby facilitating their implementation.
- Complex models like Recurrent Neural Networks (RNNs) can effectively identify patterns in large datasets with many variables and patient records.
- Bayesian methods can help determine disease groups, even in situations where perfect data for comparison is unavailable.
- The FSSMC method helps cut down the number of variables you need to consider and ranks them based on their predictive utility for disease identification.
- Methods like clustering can group patients based on similarity, even without predefined disease labels.
Simpler approaches can also be used in healthcare analytics for data extraction and transformation. One method is to define data requirements and use ETL pipelines. These pipelines extract data from different sources, transform it, and load it into a target database or data warehouse. ETL pipelines are efficient for processing large volumes of data, ensuring data integrity and consistency for analysis and reporting. While not as advanced as NLP or machine learning, these methods still provide valuable insights and practical solutions for organizations to leverage their data effectively.
Leverage your healthcare organization's data analytics with our tailored healthcare business intelligence solutions. Our expert team employs advanced strategies to derive actionable insights from your clinical records and diverse data sources. Contact us now for advanced analytics to improve operations.
Data Cleaning in Healthcare
The primary purpose of EHR databases lies in supporting the daily operations of healthcare, such as billing, legal documentation, and user-friendliness for clinical staff. However, this singular focus presents challenges for analytics.
The purpose of data cleaning is to ensure that the analysis conducted is meaningful and focused on answering analytics questions, rather than battling errors or inconsistencies.
This process aims to achieve a more uniform distribution of lab values.
Various tasks fall under data cleaning, such as eliminating redundancies, rectifying errors, harmonizing inconsistencies in coding systems, and standardizing measurement units.
- Consolidating patient data from various clinical visits that have conflicting records of race, gender, or birthdate.
- Harmonizing disease diagnosis, procedures, surgical interventions, and other data that may be recorded using varied coding systems like ICD-9, ICD-10, or ICD-10-CM.
- Correcting variations in the spelling of the same medication's generic names.
- Standardizing the units used for lab test results or clinical measurements that vary across different patient visits.
Data cleaning is essential for the entire EHR database to support all types of projects and analyses, except for projects that focus on studying errors in data entry or management.
Data cleaning methods should be tailored to the specific errors and structure of each EHR database. The provided methods serve as a foundation, but must be customized for each project. The first data cleaning project is usually the most time-consuming, but team experience with the database and common errors can help speed up the process for later projects.
EHR data cleaning tools
Many existing tools address datasets from specific healthcare facilities or focus solely on one aspect of data cleaning (like standardizing units). Some tools might be better suited for project-specific fine-tuning rather than broad database cleaning.
Data Wranglers
Data wranglers are tools specifically designed to handle diverse data types and offer transformations like reformatting dates, handling missing values, and pattern detection. Examples: DataWrangler (Stanford) and Potter's Wheel (UC Berkeley).
They work with many data formats, help users understand big datasets quickly, and have optimized code for handling large datasets. While adaptable, they might not address the specific complexities and inconsistencies found in EHR data. Specialized EHR data cleaning tools may be necessary for the best results.
Data Cleaning Tools for Specific EHR Datasets
EHR databases can differ in сoding systems (e.g., ICD-10 vs. ICD-10-CM), date formats (European vs. US style), address Formats (country-specific). Because of this, data cleaning tools often need to be tailored to specific EHR database systems. It is unlikely that a single tool will universally apply to all databases.
Even if certain tools aren't directly transferable, researchers can still learn valuable cleaning methods and approaches by studying tools like the "rEHR" package. rEHR package acts as a wrapper for SQL queries, making it easier for researchers to work with the EHR database.
Statistical data cleaning methods also exist.
For example, the Height Cleaning Algorithm detects and removes unlikely height measurements (like negative changes) based on median values across life stages. This algorithm is relatively simple to implement and catches many errors. But there are risks removing rare, but valid, data points (e.g., post-surgery height changes).
Healthcare Data Quality Assessment
Here's a summary of data quality metrics for assessing EHR data.
- Checking if data values are within expected ranges and follow known distributions. For example, pulse oximetry values should be between 0 and 100%.
- Verifying the soundness of the database structure, such as securing each patient, has a unique primary key.
- Ensuring consistent formatting of time-varying data and logical changes over time.
- Examining for logical data transitions. For instance, there should be no blood pressure measurements for a patient after their recorded death. However, it is important to note that rare exceptions may exist.
- Evaluating relationships between attributes, such as confirming a male patient does not have a pregnancy diagnosis.
Common EHR Data Errors and Fixing Methods
Cleaning methods primarily target tables containing numerical results from encounters, labs, and clinical events (vital signs). Issues with diagnosis codes, medication names, and procedure codes also can be addressed.
Demographics Table
The demographics table is the cornerstone of data quality assessment.
Fixing Multiple Race and Gender
Data analysis relies on unique identifier codes for individuals, especially sensitive personal information like medical records, instead of using actual names or identifying information. This is done to protect patient privacy and anonymize the data. It functions as a random ID tied to individuals or samples in the dataset, maintaining their anonymity.
"Patient Surrogate Key" (Patient SK) is the unique key for each patient in a medical dataset. Data analysts can track patient records, test results, treatments, etc. without exposing personal information.
Multiple demographic entries in a patient's records may have conflicting race or gender information.
This is how we fix race/gender inconsistencies:
- Gather all Patient IDs linked to a given Patient SK, collecting all demographic data associated with that individual.
- Discard entries with missing race or gender (NULL, etc.) as they are likely incomplete or unreliable.
- If a clear majority of the remaining entries agree on a race or gender, assign that as the most probable value for the patient.
- If there is no clear majority, default to the earliest recorded value as a likely starting point.
Fixing Multiple Patient Keys for the Same Encounter ID
The error of linking multiple unique patient identifiers (Patient SKs) to the same Encounter ID undermines the EHR database's integrity. If this error is widespread, it reveals a fundamental problem with the database structure itself, requiring a thorough investigation and potential restructuring. If this error occurred rarely, the affected records may be removed.
Fixing Multiple Calculated Birth Date
In the healthcare database under analysis, patient age information may be stored across multiple fields—years, months, weeks, days, and hours. There are three scenarios for recording a patient's age:
- All age fields are blank, indicating missing age information.
- Only the "age in years" field is filled, providing an approximate age.
- All age fields (years, months, weeks, days, hours) are filled, allowing for precise calculation of the patient's age.
It is important to consider that each patient's records may cover multiple visits, and the age values may vary between these visits.
To determine the accurate birth date, we follow a systematic procedure:
- If all recorded ages are blank, the birth date is missing and cannot be calculated.
- If all ages have only the years filled, we either use the birth year indicated by the majority of encounters or the first recorded age in years as an approximation of the birth year.
- If at least one encounter has all age fields filled (third scenario), we calculate the birth date from the first such encounter.
This procedure ensures that we derive the most accurate birth date value possible from the available data fields.
Lab Table
Large EHR databases are used by multiple healthcare facilities. Each facility may use different kits or equipment to evaluate the same lab measurement. This leads to varying normal reference ranges for measurements, like serum potassium level. Additionally, EHR system providers allow each facility to use customized data entry structures.
These two factors resulted in multiple formats being used to report the same lab measurement.
For example, in one dataset, serum potassium level was reported using 18 different formats!
Another major issue plaguing EHR data is inconsistency during data entry.
In an example database, it was noticed that some electrolyte concentration levels were incorrectly reported as "Millimeter per liter" instead of the common "Millimoles per liter" format.
Another common mistake is mixing and confusing the lab IDs for count versus percentage lab results.
This is prevalent in measurements related to White Blood Cells (WBC). For example, the database can have different lab ID codes for Lymphocyte Percentage (measured as a percentage of the total WBC count) and the absolute Lymphocyte Count. However, due to operator misunderstanding or lack of awareness, the percentage of lymphocytes is sometimes erroneously reported under the lab ID for the lymphocyte count, with the unit of measurement also incorrectly listed as a percentage.
Instead of deleting these mislabeled values, which would increase the amount of missing data and introduce bias, we can develop a mapping table approach. This involves creating a conversion map to consolidate the data and make the reporting format uniform across all entries. Specifically, we can map the mislabeled percentage values to their appropriate lab ID code for the lymphocyte percentage. By employing this mapping, we are able to resolve the data entry errors without losing valuable data points.
Developing Conversion Map
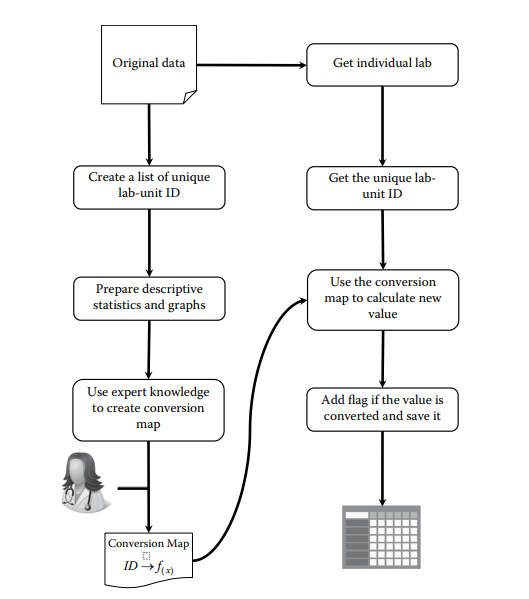
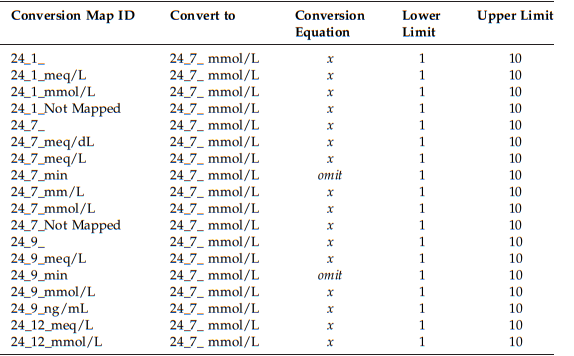
The conversion map is a table that helps us convert lab data from different formats into a unified representation.
We use mathematical formulas in the Conversion Equation column to transform the original values into the desired format.
If the original and target formats have similar distributions, no conversion is necessary. But if they are different, we need to find the appropriate conversion equation from medical literature or consult with clinicians.
To handle extreme or invalid values, we incorporate Lower and Upper Limits based on reported value ranges in medical journals. Values outside these limits are considered missing data.
General strategies for managing the output of the data cleaning process
When working with large EHR datasets, it is necessary to keep the unique identifiers in your output unchanged. These identifiers are required for merging data tables during subsequent analyses.
It is also advised to be cautious when deciding to remove values from the dataset. Unless you are certain that a value is an error, it is recommended not to drop it.
To maintain a comprehensive record of the data cleaning process and facilitate backtracking, we save the results and outputs at each step in different files. This practice helps you keep track of different file versions.
When sharing cleaned data with different teams or data analysis users, it is helpful to flag any remaining issues in the data that could not be addressed during cleaning. Use flags like "Kept," "Missing," "Omitted," "Out of range," "Missing equation," and "Canceled" for lab data.
Clinical Events
The clinical event table, specifically the vital signs subgroup, has a similar structure to the lab table in EHR databases. So, you can apply the same steps and approaches from the data cleaning tool to the clinical event table. However, it is important to note that this table may also contain other inconsistencies.
Variable Combining
In the clinical event table, a common issue is the use of unique descriptions for the same clinical event. This happens because multiple healthcare facilities use the database, each with their own labeling terminology. To tackle this challenge, statistical techniques and clinical expertise are used to identify events that can be combined into one variable.
For instance, there are many distinct event code IDs for the Blood Gas test, some with similar descriptions like "Base Excess," "Base Excess Arterial," and "Base Excess Venous." Once expert clinicians confirm these labels can be combined, a decision can be made to consolidate them into a single variable.
Medication Table
Medication tables present their own unique challenges and inconsistencies that require different strategies.
The data in the Medication table consists mainly of codes and labels, not numerical values. When working with this table, using generic medication names is more efficient than relying solely on medication codes (like National Drug codes). However, even within the generic names, there can be inconsistencies in spelling variations, capitalization, and the use of multiple words separated by hyphens, slashes, or other characters.
Procedure Table
Procedure codes identify surgical, medical, or diagnostic interventions performed on patients. These codes are designed to be compatible with diagnosis codes (such as ICD-9 or ICD-10) to ensure proper reimbursement from insurance companies, like Blue Cross Blue Shield or Medicare, which may deny payment if the procedure codes do not align with the documented diagnosis.
Three types of procedure codes are commonly used.
ICD-9 procedure codes
Consist of two numeric digits followed by a decimal point, and one or two additional digits. They differ from ICD-9 diagnosis codes, which start with three alphanumeric characters. ICD-9 procedure codes are categorized according to the anatomical region or body system involved.
CPT (Current Procedural Terminology) codes
Also known as Level 1 HCPCS (Healthcare Common Procedure Coding System) coding system, CPT codes are a set of medical codes used to report medical, surgical, and diagnostic procedures and services. Physicians, health insurance companies, and accreditation organizations use them. CPT codes are used in conjunction with ICD-9-CM or ICD-10-CM numerical diagnostic coding during electronic medical billing. These codes are composed of five numeric digits.
HCPCS Level II codes
Level II of the HCPCS is a standardized coding system used primarily to identify products, supplies, and services, such as ambulance services and durable medical equipment when used outside a physician's office. Level II codes consist of a single alphabetical letter followed by four numeric digits.
The data cleaning for the procedure table often may not be necessary.
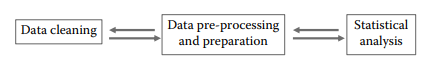
Healthcare Data Pre-Processing
Variable Encoding
When working with EHR datasets, the data may contain records of medications, diagnoses, and procedures for individual patients.
These variables can be encoded in two ways:
1) Binary encoding, where a patient is assigned a value of 1 if they have a record for a specific medication, diagnosis, or procedure, and 0 otherwise.
2) Continuous encoding, where the frequency of occurrence of these events is counted.
Tidy Data Principles
Variable encoding is a fundamental data pre-processing method that transforms raw data into a "tidy" format, which is easier to analyze statistically. Tidy data follows three key principles: each variable has its own column, each observation is in one row, and each cell holds a single value.
Variables are often stored at different tables within the database. To create a tidy dataset suitable for analysis, these variables need to be merged from their respective tables into one unified dataset based on their defined relationships.
The encounter table within an EHR database typically already meets the tidy data criteria. However, many other tables, such as the medication table, often have a "long" data format where each observation spans multiple rows. In these cases, the long data needs to be transformed.
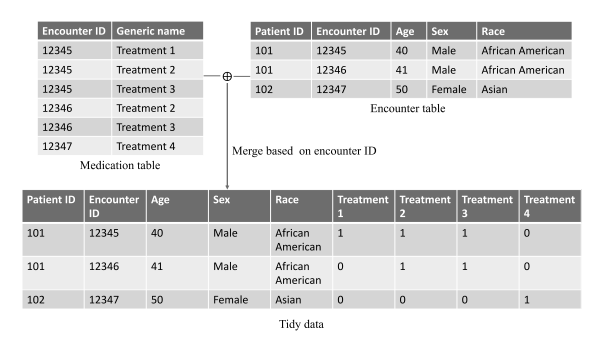
To create a tidy dataset, we follow a few steps:
- Each variable is put into one column. The multiple treatment variables in the medication table are transformed into separate columns (Treatment 1, Treatment 2, Treatment 3, Treatment 4) in the tidy data. This ensures that each variable has its own dedicated column.
- Each observation is in one row. The encounter table already has one row per encounter observation. After merging with the transformed medication data, the tidy dataset maintains this structure, with one row representing all variables for a single patient encounter.
- Each cell has a single value. In the tidy data, each cell contains either a 1 (treatment given) or 0 (treatment not given). This adheres to the principle of having a single atomic value per cell.
The merging process combines the encounter table (with patient ID, encounter ID, age, sex, and race variables) and reshaped medication data to create a final tidy dataset. The merging process combines the encounter table and reshaped medication data to create a final tidy dataset. Each row corresponds to one encounter and includes relevant variables like treatments, demographics, and encounter details.
Feature Extraction: Derived Variables
Сertain variables, such as lab test results, clinical events, and vital signs, are measured repeatedly at irregular time intervals for a patient
Instead of using the raw repeated measurements, feature extraction and engineering techniques are applied to summarize them into derived feature variables.
One common approach is to calculate simple summary statistics like mean, median, minimum, maximum, range, quantiles, standard deviation, or variance for each variable and each patient. Let's say a patient's blood glucose levels are recorded as follows: 90, 125, and 100. Features such as mean glucose (105), maximum glucose (125), and glucose range (35) could be implemented.
Derived feature variables can also come from combining multiple original variables, such as calculating body mass index from height and weight.
Additionally, features related to the timing of measurements can be extracted, such as the first measurement, the last measurement, or measurement after a particular treatment event. The goal is to extract as many relevant features as possible to minimize information loss.
Dimension Reduction
Variable Grouping or Clustering
Many EHR variables, such as disease diagnoses, medications, lab tests, clinical events, vital signs, and procedures, have high dimensions. To reduce data complexity, we can group or cluster these variables into higher-level categories. This also helps to ensure a sufficient sample size for further analysis by combining smaller categories into larger ones.
For example, the ICD-9-CM system comprises over ten thousand diagnosis codes. However, we can use the higher-level ICD-9-CM codes with only three digits, representing less than 1000 disease groups.
Healthcare Data Analysis and Prediction
Statistical Models
EHR datasets are big, messy, sparse, ultrahigh dimensional, and have high rates of missing data. These characteristics pose significant challenges for statistical analysis and prediction modeling. Due to the ultrahigh dimensionality and potentially large sample sizes of EHR data, complicated and computationally intensive statistical approaches are often impractical. However, if the dataset is properly cleaned and processed, certain models, like general linear models, survival models, and linear mixed-effects models, can still be appropriate and workable to implement.
Generalized linear models (GLMs) are commonly used and effective for analyzing EHR data due to their efficiency and availability of software tools.
For time-to-event analysis, survival regression models are better suited than GLMs, but they need to account for issues like missing data and censoring in EHR data.
Mixed-effects models are useful for handling longitudinal EHR data with repeated measures and irregular timing.
Dealing with the high dimensionality is a major challenge, requiring techniques like variable screening (SIS), penalized regression (LASSO, Ridge), and confounder adjustment methods.
Large sample sizes in EHR data pose computational challenges, requiring approaches like divide-and-conquer, sub-sampling, and distributed computing.
Neural Network and Deep Learning Methods
Deep learning (DL) is a class of machine learning techniques that uses artificial neural networks with multiple hierarchical layers to learn complex relationships between inputs and outputs. The number of layers can range from a few to many, forming a deeply connected neural network, hence the term "deep" learning. DL models have input, hidden, and output layers connected through weights and activation functions. DL techniques are increasingly applied to various aspects of EHR data analysis due to their ability to handle high dimensionality and extract complex patterns.
Deep learning approaches can be categorized as supervised learning for recognizing numbers/texts from images, predicting patient diagnoses, and treatment outcomes, and unsupervised learning for finding patterns without predefined labels or target outcomes.
Supervised learning is the most developed category for EHR data analysis.
DL has some advantages over classical machine learning for EHR data:
- Can handle both structured (codes, tests) and unstructured (notes, images) data
- Can automatically learn complex features from raw data without manual feature engineering
- Can handle sparse, irregularly timed data better
- Can model long-term temporal dependencies in medical events
- Can be more robust to missing/noisy data through techniques like dropout
However, DL models require careful hyperparameter tuning to avoid overfitting.
Types of Deep Learning Networks
Multilayer Perceptron (MLP)
The foundational DL model, with multiple layers of neurons. Good for basic prediction tasks in EHR data.
Convolutional Neural Network (CNN)
Excels at analyzing data with spatial or local relationships (like images or text). Used for disease risk prediction, diagnosis, and understanding medical notes.
Recurrent Neural Network (RNN)
Designed for sequential data (like EHRs over time). Can account for long-term dependencies between health events. Used for disease onset prediction and readmission modeling.
Generative Adversarial Network (GAN)
A unique approach where two networks compete. Used for generating realistic synthetic EHR data and disease prediction.
Choosing the Right Architecture
- CNNs are great for images and text.
- GANs offer more flexibility (data generation, prediction) but can be harder to train.
- RNNs are good for long-term dependencies but can be computationally slower.
Deep Learning Software Tools and Implementation
TensorFlow, PyTorch, Keras, and others offer powerful tools to build and train DL models. They are often free and constantly updated by a large community. Online tutorials and documentation make learning DL more accessible.
TensorFlow
Mature framework, easy to use, especially with the Keras open-source library that provides a Python interface for artificial neural networks). It has a large community and is production-ready, with good visualization tools. However, it may have less of a "Python-like" feel in its basic form and there may be potential compatibility issues between versions.
PyTorch
Feels like standard Python coding, easy to install and debug, offers more granular control of the model. However, without Keras, it requires more coding effort and the performance can vary depending on how you customize it.
We have a team of BI analysts who tailor solutions to fit your organization's unique requirements. They create sharp dashboards and reports, leveraging advanced statistical and machine learning techniques to uncover valuable insights from complex healthcare data. Contact our experts to integrate BI for a comprehensive view of patient care, operations, and finances.

Rate this article
Recommended posts
.png)
.jpg)
.jpg)
.jpg)
.jpg)
.jpg)
.jpg)
.jpg)
.jpg)
.jpg)
.jpg)
.jpg)
.jpg)
.jpg)
.jpg)
.jpg)
.jpg)
.jpg)
.jpg)
.jpg)
.jpg)
.jpg)
.jpg)
.jpg)
.jpg)
.jpg)
.jpg)
.jpg)
.jpg)
.jpg)
.jpg)
.jpg)
.jpg)
.jpg)
.jpg)
.jpg)
.jpg)
.jpg)
.jpg)
.png)
.jpg)
.jpg)
.jpg)
.jpg)
.jpg)
.jpg)
.jpg)
.jpg)
.jpg)
.jpg)
.jpg)
.jpg)
.jpg)
.jpg)
.jpg)
.jpg)
.png)
.jpg)
.jpg)
Portfolio
.jpg)
Our Clients' Feedback


Belitsoft has been the driving force behind several of our software development projects within the last few years. This company demonstrates high professionalism in their work approach. They have continuously proved to be ready to go the extra mile. We are very happy with Belitsoft, and in a position to strongly recommend them for software development and support as a most reliable and fully transparent partner focused on long term business relationships.

Global Head of Commercial Development L&D at Technicolor
They use their knowledge and skills to program the product, and then completed a series of quality assurance tests. We were working in an agile way with them. Belitsoft performed very well throughout our project. We are definitely looking at Belitsoft as a long-term partner.

Service Delivery Director at Crimson (United Kingdom)
I highly recommend Belitsoft for website design and development. We were up against a tight deadline to launch the project. The work was delivered on time and within budget! I will continue working with Belitsoft as a valued partner for our web development!

Program Administrator at UC Berkeley (United States)
We have worked with Belitsoft team over the past few years on projects involving much customized programming work. They are knowledgeable and are able to complete tasks on schedule, meeting our technical requirements. We would recommend them to anyone who is in need of custom programming work.

Main Partner at Hathway Tech (United States)
Belitsoft company is able to make changes instantly. One of our internal engineers has commented about how clean their code is. Belitsoft seems to know what they're doing, which I appreciate.

Co-Founder at HOWCAST MEDIA (United States)
It was a great pleasure working with Belitsoft software development company. New requirements and adjustments were implemented fast and precisely. We can recommend Belitsoft and are looking forward to start a follow-up project.

Head of Division at Fraunhofer FIT (Germany)
Belitsoft company has been able to provide senior developers with the skills to support back end, native mobile and web applications. We continue today to augment our existing staff with great developers from Belitsoft.

CEO at Apollo Matrix (United States)
Belitsoft company delivered dedicated development team for our products, and technical specialists for our clients' custom development needs. We highly recommend to use this company if you want the same benefits.

Managing Director at Key2Know A/S in 2012 (Denmark)
We approached BelITsoft with a concept, and they were able to convert it into a multi-platform software solution. Their team members are skilled, agile and attached to their work, all of which paid dividends as our software grew in complexity.

COO at Regenerative Medicine LLC (United States)
Having worked with Belitsoft as a service provider, I must say that I'm very pleased with the company's policy. Belitsoft guarantees first-class service through efficient management, great expertise, and a systematic approach to business. I would strongly recommend Belitsoft's services to anyone wanting to get the right IT products in the right place at the right time.

CEO at Moblers
If you are looking for a true partnership Belitsoft company might be the best choice for you. They have proven to be most reliable, polite and professional. The team managed to adapt to changing requirements and to provide me with best solutions. I strongly recommend Belisoft.

Director at ShowCast Limited (Germany)
I expected and demanded a lot of you at Belitsoft company, but you exceeded my expectations. You acted pro-actively, challenged me at the right moments. Thanks!"

CEO at Ticken B.V. (Netherlands)
We have been working for over 10 years and they have become our long-term technology partner. Any software development, programming, or design needs we have had, Belitsoft company has always been able to handle this for us.
Founder from ZensAI (Microsoft)/ formerly Elearningforce