The healthcare business intelligence software market is experiencing explosive growth (some analysts even predict up to a 25% CAGR over the next 5 years) and a second wind due to technological advancements related to the implementation of generative AI capabilities. The level of self-service in BI tools is becoming so high that users need very little technical knowledge to obtain complex, high-quality data for decision-making.
Our team of BI developers configures healthcare dashboards and reports for your organization by consolidating data from diverse sources. We offer implementation of Amazon QuickSight, Microsoft Power BI, Tableau, Google's Looker, Oracle, SAP, Sisense, and more.
What is Business Intelligence in Healthcare?
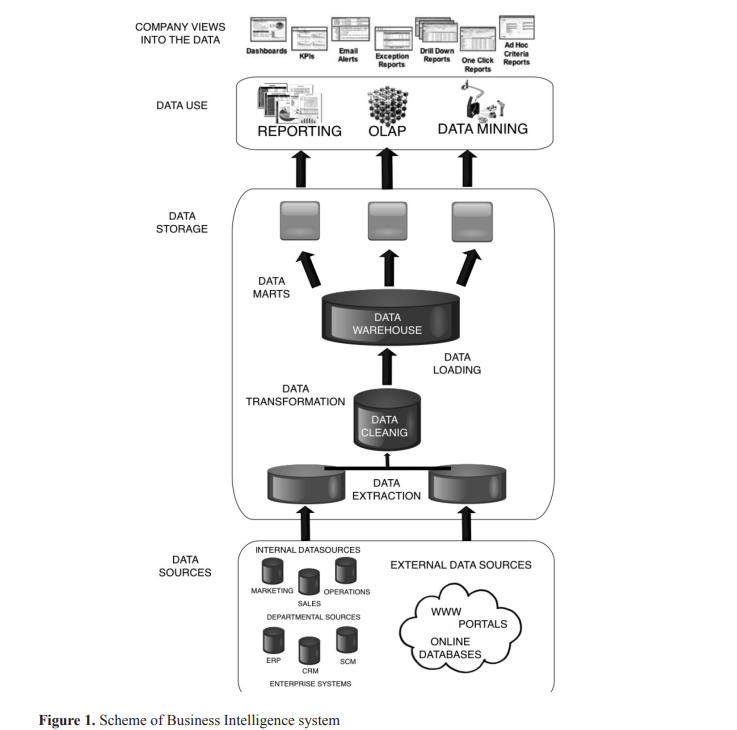
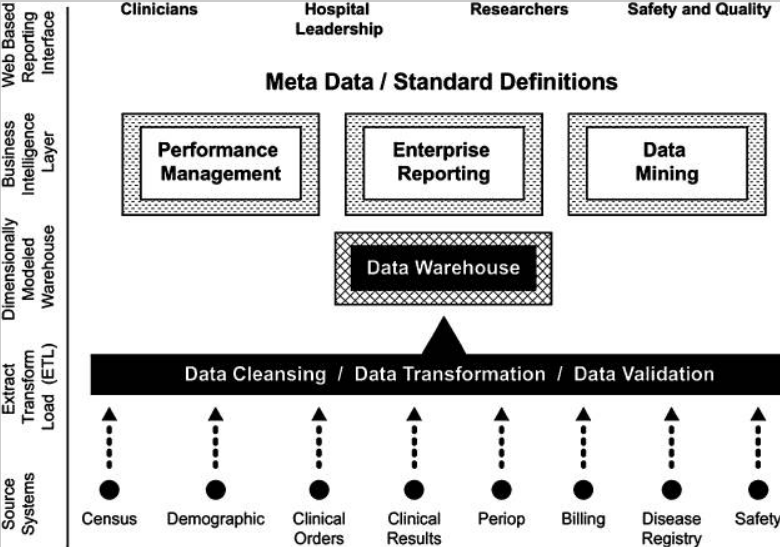
Healthcare business intelligence, as a subset of healthcare data analytics, takes historical health-related data from multiple internal and external sources and visualizes it multidimensionally.
EHR/EMRs, labs, eHealth/mHealth apps and smart wearables, governmental agencies, accounting tools, and CRM platforms are among some of them.
Data is saved, then analyzed, and finally reported.
Cloud database development makes the process of healthcare data storage, data retrieval, and data analysis more efficient and secure.
Using the information gained, it's possible to improve patient satisfaction and the financial performance of medical centers, clinics, hospitals, insurance vendors, research facilities, pharmaceutical companies, and data technology firms.
Top Features to Look For in Healthcare Business Intelligence Software
- Security. User administration, platform access auditing, authentication management)
- Cloud-Readiness. The ability to build, deploy, and manage the BI software in the cloud across multi-cloud and hybrid cloud deployments.
- Data Source Connectivity. Enabling users to connect to and ingest data from various storage platforms, including on-premises and cloud. Supporting users to combine data from different sources using drag-and-drop.
- Data Preparation. Creating analytic models with user-defined measures, sets, groups, and hierarchies.
- Automated Insights, Natural Language Generation, and Data Storytelling. Applying machine learning to automatically generate insights and identify the most important attributes in a dataset. Automatically creating descriptions of insights in data that explain key findings or the meaning of charts or dashboards. Generating news-style data stories that combine headlines, narrative text, data visualizations, and audiovisual content based on ongoing monitoring of findings.
- Natural Language Searching. Enabling users to query data using terms typed into a search box or spoken.
- Data visualization. Supporting highly interactive dashboards and exploring data through manipulating chart images, including heat maps, tree maps, geographic maps, scatter plots, and other special-purpose visuals.
- Reporting. Providing parameterized, paginated, and pixel-perfect reports that can be scheduled and burst to a large user community.
Top 7 Business Intelligence Software Tools for Healthcare
With an emphasis on visual self-service, today's healthcare BI software incorporates AI and empower non-technical users to model and analyze data and share insights.
Gartner lists Amazon QuickSight, Microsoft Power BI, Tableau, Google's Looker, Oracle, SAP and Sisense among top BI software providers.
What possibilities do they bring to health-related companies?
#1 Amazon QuickSight
The key feature of Amazon's business intelligence tool, QuickSight, is a generative AI assistant named Q.
It creates interactive visualizations, dashboards, reports, and customizable data stories on demand—without sending requests to the busy and overloaded BI team or waiting weeks or even months—simply by typing exact questions into the Q bar. Outputs include citations and references for transparency.
API access allows integration of this capability into third-party applications. To make this business intelligence tool work, it should have access to your documents, images, files, and other application data, as well as structured data stored in databases and data warehouses.
QuickSight connects with over 50 commonly used business tools and unstructured data sources (wikis, intranets, Atlassian, Gmail, Microsoft Exchange, Salesforce, ServiceNow, Slack, etc.).
#2 Microsoft Power BI
Microsoft Power BI is a comprehensive data analytics tool available as a software-as-a-service option on Azure. It provides data preparation, visual data exploration, interactive dashboards, and augmented analytics. Power BI Premium includes AI-powered text, sentiment, and image analytics.
Power BI seamlessly integrates with Office 365, including Microsoft Teams, Excel, and SharePoint. It can be enhanced by embedding Power Apps into its dashboards, and Power Automate flows can automate tasks based on the data.
However, Power BI is limited to deployment on Azure and does not offer options for other cloud infrastructure as a service (IaaS). While data connectivity enables multi-cloud and hybrid cloud scenarios, governance of self-service usage is a common concern. On-premises Power BI Report Server has a more limited offering without features such as dashboards, streaming analytics, prebuilt content, natural language question and answer, automated insights, and alerting.
To overcome the limitations of Power BI and use a more integrated analytics experience, as well as fully utilize their data infrastructure, organizations can transition to Microsoft Fabric. Belitsoft offers expert migration services to facilitate this shift, making the transition effortless for your workflows.
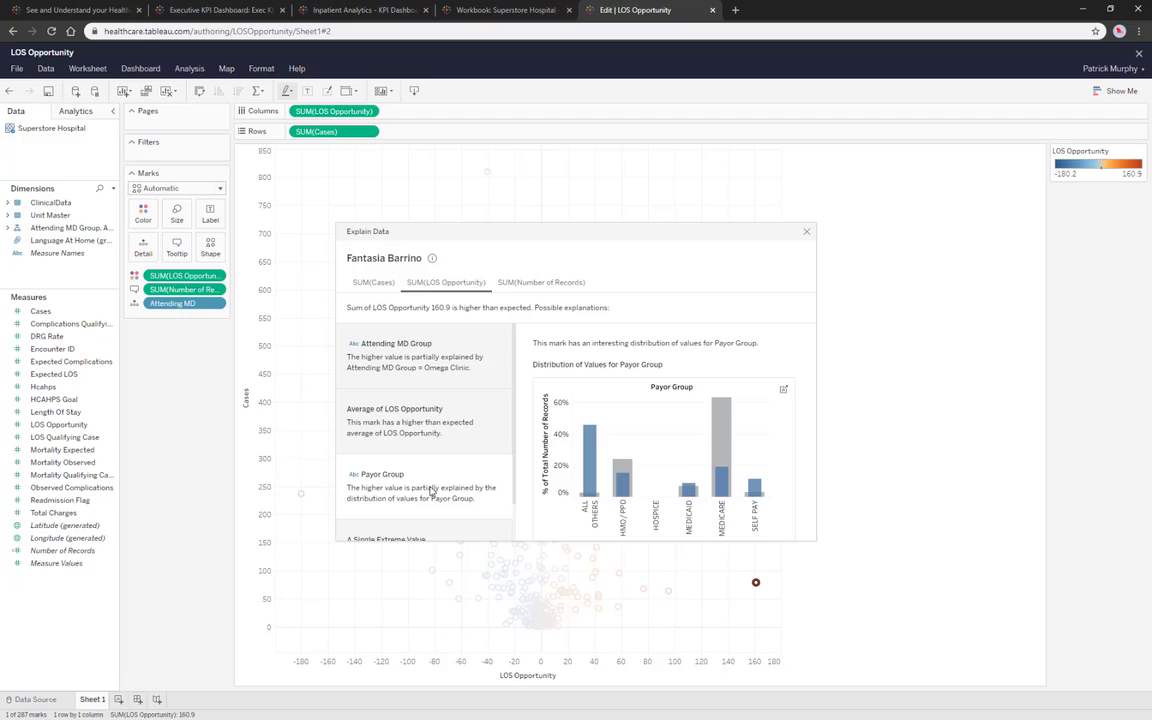
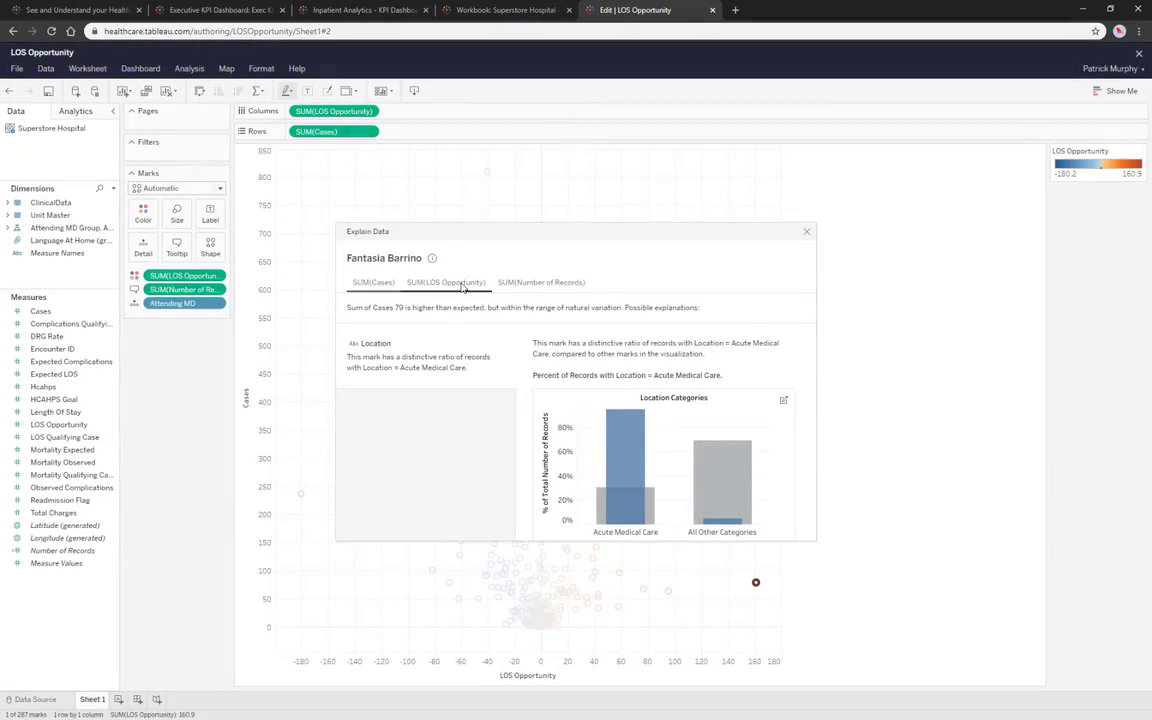
#3 Tableau
Tableau, a product from Salesforce, offers a user-friendly way to access, prepare, analyze, and present data. It empowers business users to explore visually their data with an intuitive drag-and-drop interface powered by the VizQL engine.
Tableau provides a natural language query feature called Ask Data that can be integrated into a dashboard, and a data explanation tool called Explain Data. The vendor focuses on extending their natural language generation and data storytelling capabilities. Analysts can curate existing datasets using Lenses and access dashboard accelerators on the Tableau Exchange. The tool also offers centralized row-level security and virtual data connections.
However, Tableau's licensing costs are relatively high, with additional fees required for features such as Data Management, Server Management, and Einstein Discovery. Some users report below-average satisfaction with Tableau's overall service and support, making it sometimes challenging to find Tableau-specific assistance.
#4 Google’s BI software for healthcare
Google's Looker is a cloud-based BI platform that provides users with self-service visualization and dashboard capabilities. It supports multi-cloud scenarios for deployment and database connectivity, with continuous integrations with other Google Cloud products like BigQuery.
Looker's extension framework is a fully hosted development surface that allows developers to build data-driven applications. It offers direct query access to cloud databases, lakes, and applications as its primary data connectivity method. This enables users to leverage LookML's virtualized semantic layer without having to move their data.
Google aims to open up the LookML data modeling layer to other BI platforms, including Microsoft Power BI, Tableau, and its own assets like Data Studio, Google Sheets, and Google Slides. Looker's APIs, software development kits, and extension framework, including the Data Dictionary, enable customers to create customer-facing applications and embed analytics in business workflows. The Looker Marketplace offers prebuilt data and machine-learning model Blocks to address common analytical patterns and sources.
While Looker may have coding requirements compared to competitors' drag-and-drop data modeling and advanced analytics capabilities, it provides prebuilt data and ML model Blocks to mitigate this. However, Looker currently lacks augmented analytics features for automated insights, data storytelling, and Natural Language Generation, and its Natural Language Query interface is weaker compared to competitors.
#5 Oracle Healthcare BI
Oracle offers a comprehensive BI cloud solution that includes infrastructure, data management, and analytics applications. With data centers in 30 regions, Oracle supports customers' multicloud needs through an open architecture approach.
Oracle focuses on conversational user experiences and automated data storytelling features. These include generating audio podcasts that highlight key trends, data changes, outliers, and contextualized insights. Users can benefit from Natural language queries in 28 languages and Oracle Analytics Day by Day for mobile devices.
For on-premises deployments, Oracle offers Oracle Analytics Server, and for Oracle Cloud Applications, prebuilt analytics solutions are available through Fusion Analytics Warehouse. The Oracle warehouse provides native integration for Oracle's ERP, human capital management, supply chain, and NetSuite products.
Although Oracle Analytics Cloud can access any data source, its packaged analytic applications (Fusion Analytics Warehouse and NetSuite Analytics Warehouse) are designed specifically for Oracle enterprise applications. Non-Oracle application customers would need to build their own applications using Oracle Analytics Cloud to gain similar capabilities. It's worth noting that customers have reported below-average satisfaction with Oracle's service and support. Additionally, the legacy Oracle Healthcare Foundation (OHF) analytics solution is no longer actively supported.
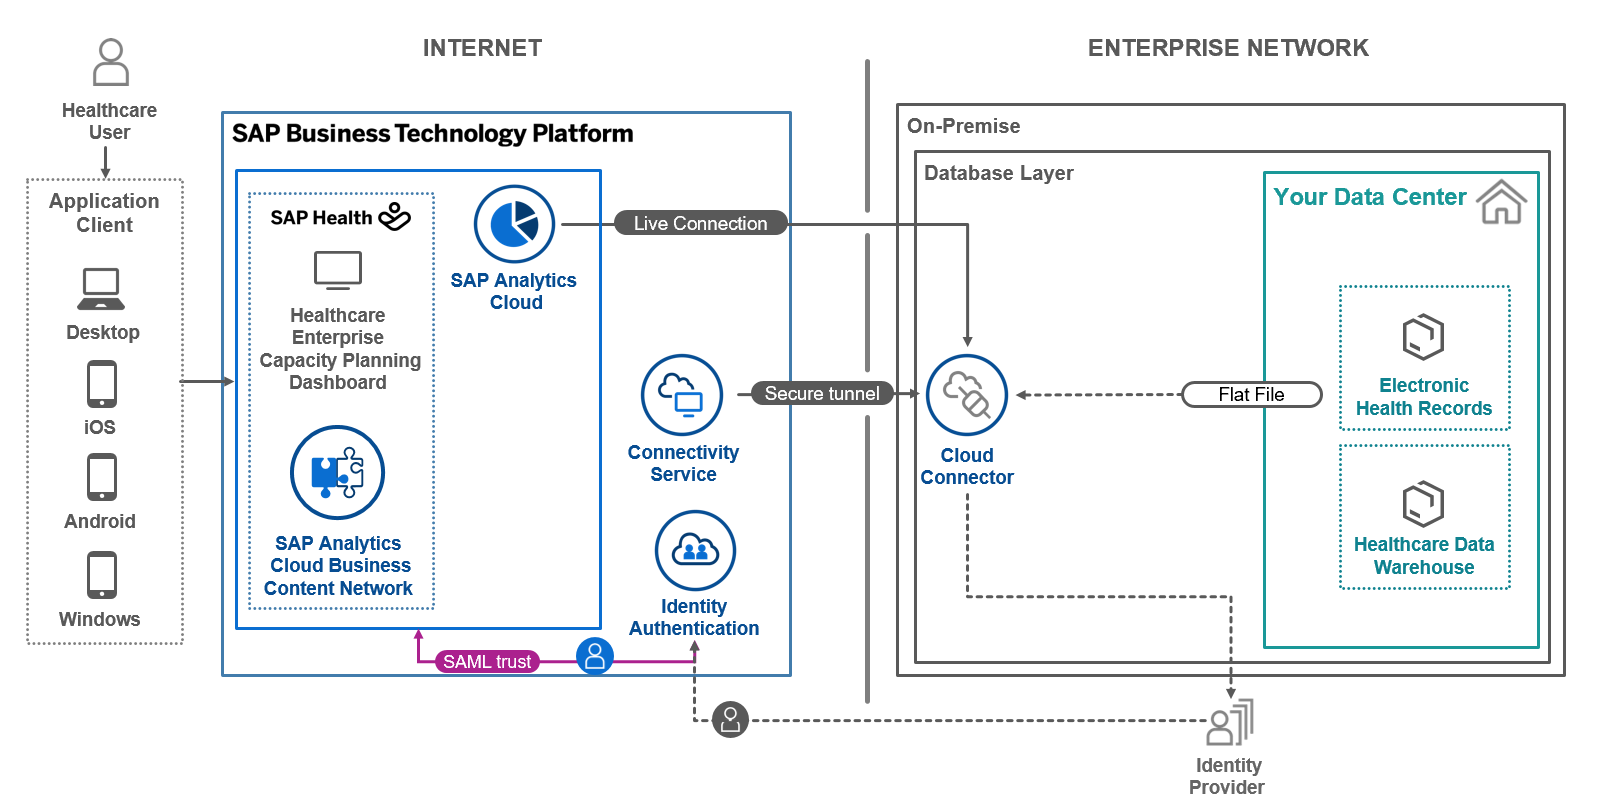
#6 SAP Healthcare BI
SAP Analytics Cloud is a cloud-based platform that integrates with SAP cloud applications and can query both cloud and on-premises SAP resources, such as SAP Business Warehouse, for live data. Its user-friendly Story Viewer and Story Designer tools enable non-technical users to create and interact with dashboards and reports. The Analytics Designer, a low-code development environment, facilitates the creation of analytics applications using APIs.
SAP Analytics Cloud stands out with its integrated functionality for planning, analysis, and prediction. It offers "what-if" analysis, change tracking, and calculation capabilities. The platform also includes strong functionality for natural language generation, natural language processing, and automated insights. Its integrated functionality for planning, analysis, and prediction sets it apart from other platforms.
For the healthcare industry and related lines of business, SAP Analytics Cloud provides pre-built business content, including data models, data stories, and visualizations. However, it is primarily utilized by existing SAP business application customers and legacy business intelligence users. Customers without a SAP-centric application or data ecosystem typically do not opt for SAP Analytics Cloud.
While SAP Analytics Cloud is a cloud-native platform that can query on-premises data, customers seeking an on-premises deployment would need to use a standalone SAP BusinessObjects BI to fully leverage the analytics catalog functionality and Universe connector for a complete hybrid deployment experience.
#7 Sisense Healthcare BI
Sisense is a self-service analytics platform that offers advanced analytics and application development capabilities. Many users utilize Sisense in its OEM form.
Sisense Fusion focuses on integrating analytics into business workflows, providing interactive visualizations and natural language query capabilities. It offers a microservices-based architecture that is fully extensible, allowing for embedding analytics into applications and workflows.
Sisense Notebooks serve as a bridge between data professionals and self-service users who want to perform advanced analysis using SQL, Python, R, and other programming languages.
Infusion Apps provide users with prebuilt examples for Google Chrome, Google Sheets, Google Slides, Microsoft Teams, Salesforce, and Slack, helping to tie analytics to actions.
Sisense Fusion is cloud-agnostic and multicloud-capable, with deep partnerships with AWS, Google Cloud, and Microsoft, as well as strong cross-cloud analytics orchestration.
Sisense's analytics marketplace is a one-stop shop for publishing and building analytics artifacts, including connectors, applications, and workflows. Sisense can catalog other analytic vendors' assets via APIs, and it offers extensible connectivity to other reporting tools. Developers can utilize the Extense Framework to create custom applications or workflows or choose from prebuilt Infusion Apps for embedding analytic capabilities.
However, customers have reported below-average evaluations of third-party resources, such as integrators and service providers, as well as the overall quality of the peer user community. Sisense's service and technical support have also received below-average evaluations.
We work with B2B healthtech companies to help their clients make better use of healthcare information. Our developers create custom healthcare software based on their requests. Shortlist our company as your potential partner that has an available pool of talented data analysts and BI consultants for healthcare who can solve any business intelligence challenge by developing, customizing, and implementing complex analytics solutions.
Benefits of Business Intelligence and analytics for healthcare organizations
BI Consolidates Health Data and Protects It
Business intelligence in healthcare is about consolidating clinical, administrative, and financial data. It works even with previously loosely-related systems.
But it goes beyond that.
Business intelligence tools allow one to protect sensitive patient information. Access to different parts of this data is easily restricted to comply with HIPAA law and more.
BI Improves Decision-Making
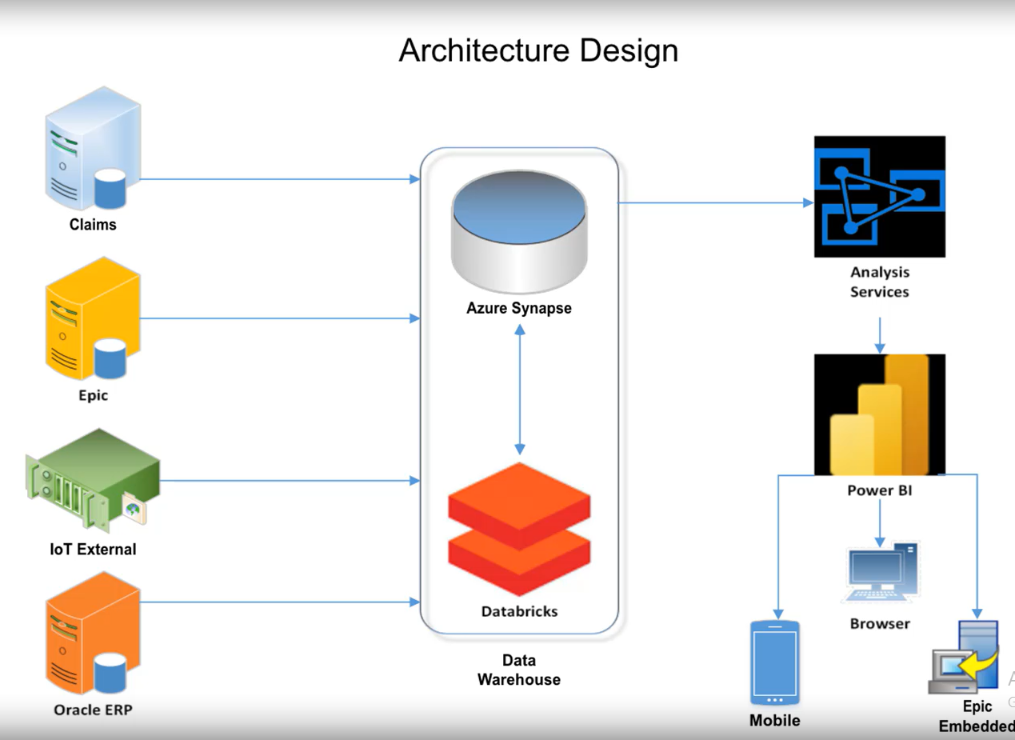
Business intelligence is a holistic visualization of all the KPIs you're tracking. It connects to multiple data sources to put the information into a single, centralized repository - a data warehouse.
BI reports and dashboards answer the question "What happened?", and "Why did it happen?" can be explored with drill-down analysis.
BI predictive analytics is based on data scientists' calculations. It's often more justified than personal opinions.
Machine learning and statistics are unbiased ways to understand "What can we expect as a result?" Simulation and scenario analysis make clear "What actions should we take?"
BI Reduces Healthcare Costs
Business intelligence can quickly interpret large and complicated data like bills, medical records, and financial statements and provide useful information in a few hours instead of days.
Coming from the research on clinical activities, supplies, logistics, costs, and outcomes, a BI helps turn data into timely resolutions. It links and puts together huge amounts of data from providers, life sciences organizations, and insurers to find cost savings, trends, and optimal treatments and medications.
With quick situational insights, unexpected challenges can be mitigated, and resources can be used more efficiently. By leveraging built-in AI capabilities, it is possible to predict and plan for future needs.
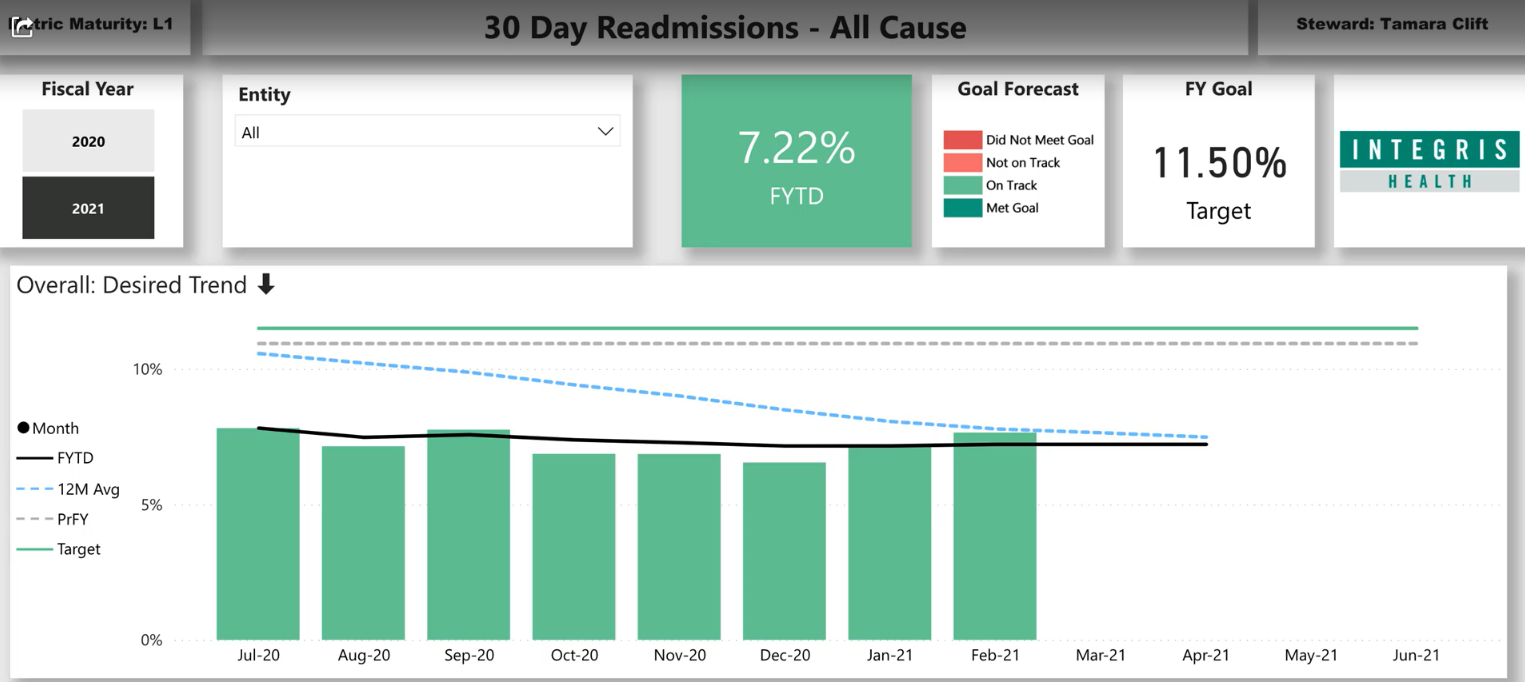
Avoid Costly Readmissions
BI software highlights the patients with a certain condition who are readmitted within, for example, 30 days of discharge. It determines the factors contributing to these readmissions, for example, medication non-adherence. Steps to address them may involve providing patients with better education and support to ensure they take their medication correctly or improving follow-up care after discharge.
Prevent Chronic Patients From Complications
Business Intelligence systems identify the patients with a certain condition are at risk for complications, like foot ulcers or kidney disease. Taking action on these cases in the initial stages leads to more targeted interventions and prevents high expenditures on developed complications. It may concern mostly medication management, acting as reminders for drug refills or pill organizers to help patients stay on track with their treatment regimen. Or it aligns remote monitoring programs that include wearable devices to track blood glucose or blood pressure levels and send alerts to healthcare providers if the levels are outside of the target range.
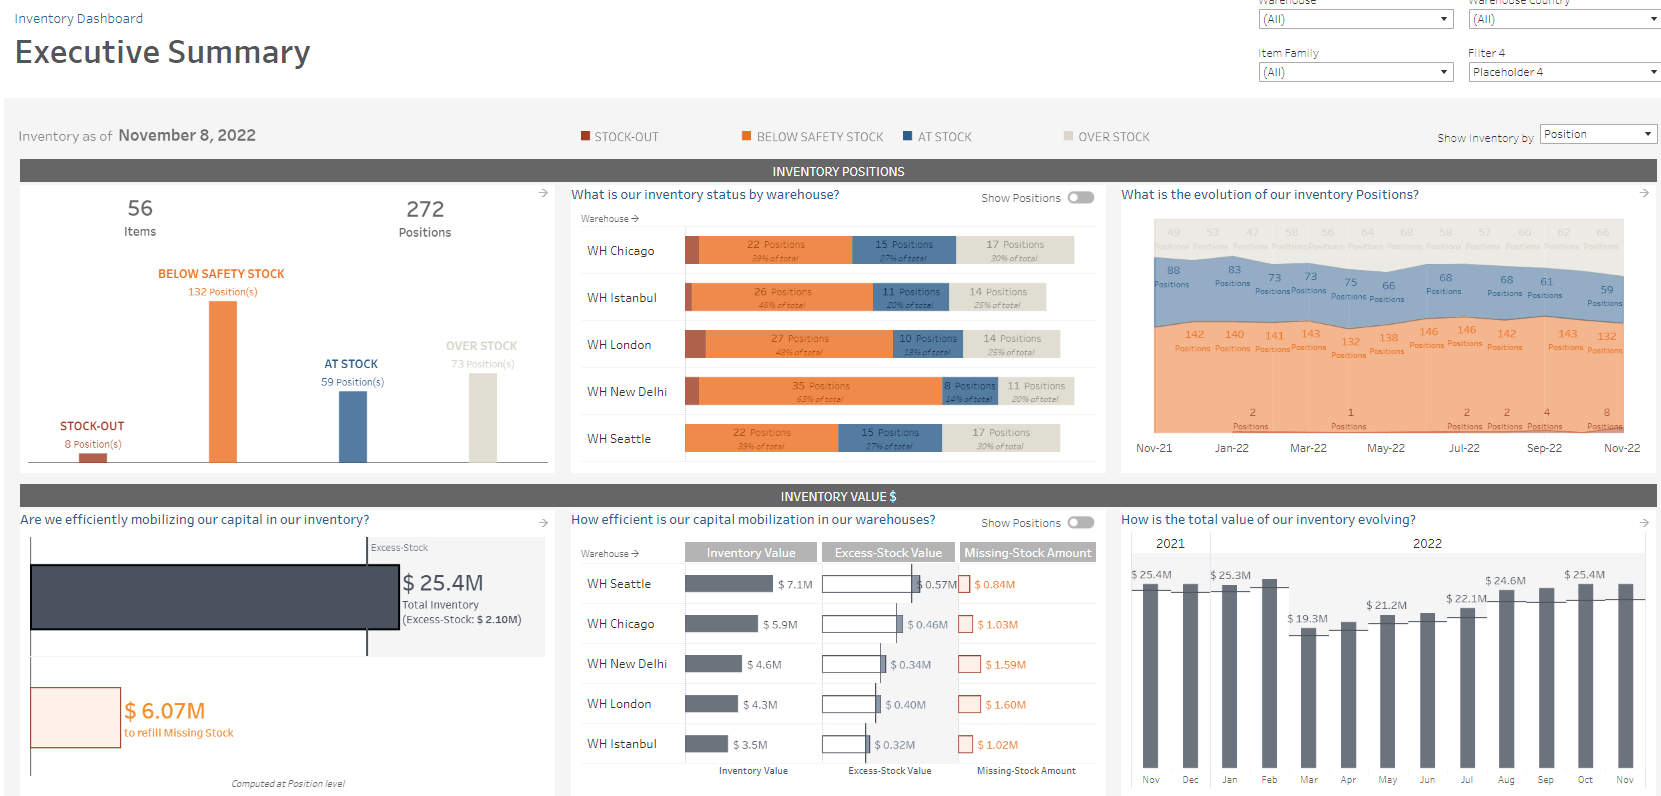
Optimize Healthcare Supply Chain Management
In the healthcare sector, supply costs are considerably high. However, leveraging data analysis BI tools holds great potential to bring down these costs. With healthcare supply chain analytics, you can identify and forecast variations in demand or potential supply disturbances, quickly recognize and address supply chain problems, and prevent or ease shortages of medical supplies and drugs. Through monitoring inventory levels and expiration dates, then evaluating usage patterns, it minimizes waste by pinpointing areas where overstocking is taking place and adjusting inventory levels accordingly.
Improved Patient Treatment
Building a data-driven approach in healthcare propels this domain forward, as 94% of healthcare stakeholders believe. They emphasized the top advantage doctors and patients can leverage from implementing healthcare BI tools and data analytics: a more personalized treatment path.
Dmitry Baraishuk Chief Innovation Officer at Belitsoft on Forbes.com

Predicting Surgical Complications
Healthcare BI tools with predictive analytics can determine a patient's risk of post-surgical complications, such as kidney failure and stroke. It should develop a special model collaboration with a multidisciplinary team comprising a surgeon, cardiologists, nephrologists, and other specialists. This predictive model determines which patients were likely to suffer a stroke, cardiac event, or die within 30 days of surgery. Health-related providers can use it at a patient's bedside to conduct pre-surgery assessments. Clinicians inform surgeons of potential risks and better advise patients, resulting in improved care delivery.
Identify Patterns and Trends in Patient Health Outcomes
The organization uses BI tools to analyze data from electronic health records: patient demographics, medical history, and treatment outcomes. Healthcare providers commit a notice. For instance, the patients with a particular condition are experiencing longer hospital stays and higher rates of readmission compared to patients with the same case at other hospitals. The Business Intelligence team works with the hospital staff to examine potential causes, like delays in diagnostic testing, longer wait times for specialty consultations, and slower medication reconciliation processes. After they operate the data to implement targeted interventions, such as optimizing the order of diagnostic tests, reducing wait times for specialty consultations, and streamlining the medication reconciliation process. Because of this interference, the hospital improves better patient outcomes.
Limitations of Healthcare Business Intelligence
Data entry, management, interpretation, and sharing can often rely on manual processes, which are prone to errors, particularly in the healthcare industry. Without a coherent system of accountability in place, these errors can accumulate and lead to further complications.
Healthcare data is a complex and heterogeneous collection originating from various sources and takes many forms. This includes patient profiles, healthcare provider information, pharmaceutical company data, disease registries, diagnostic tests, treatment options, and various types of visual data, such as scans, images, and graphs. The above databases are constantly growing as new admission, diagnostic, treatment, and they add medical records on discharge. The diverse nature of these data sources presents significant challenges with aggregating and integrating the data, constructing a data warehouse, and loading the data into a rules-based engine for generating actionable insights and reports.
Reliable Health Business Intelligence depends on accurate data access. Thus, prior to introducing a BI solution, it is vital to configure robust data management.
Healthcare Business Intelligence Analyst
A skilled BI analyst is essential, especially during the initial configuration of healthcare BI software and self-service tools. Their primary responsibility is to customize data models and dashboards to align with the unique needs of a health-related organization.
Business Intelligence Analysts work with company data to identify areas for improvement in current processes and establish metrics or KPIs to track product performance and identify areas of improvement.
These analysts possess strong data visualization skills to present their findings in a clear and understandable format to stakeholders.
The role of a Business Intelligence Analyst extends beyond reporting. They assist businesses in uncovering insights by asking the right questions and exploring data. BI analysts help to guide organizations to discover new knowledge and find answers to unanticipated questions.
To achieve this, BI specialists use a range of tools, including web analytics tools, database tools, ETL tools, and full-stack BI platforms like Power BI or Tableau.
Requirements often include:
- Experience in health informatics and healthcare analytics
- Ability to analyze data and communicate insights through dashboards and reports
- Strong SQL programming and advanced data manipulation skills
- Experience building data products using business intelligence software
- Familiarity with healthcare data sources, such as claims, electronic health records, and patient-reported data
- Detail-oriented with a focus on producing accurate and polished work
- Excellent written and oral communication skills
The specific responsibilities of a BI analyst vary depending on the company's needs.
Example 1: Devoted Health was seeking a Sales Operations BI Analyst who could work with complex data, communicate insights through data visualization, and prioritize data governance. The ideal candidate would collaborate closely with various teams within the company, including business, data science, product management, analytics engineering, data engineering, and software engineering.
Example 2: McLaren Health Care network was in search of a BI analyst to handle healthcare claims and quality data reporting, analytics, and statistical analysis. The ideal candidate would have a strong understanding of healthcare data, including cost of care and patient utilization metrics. Experience in healthcare analysis, including statistical methods, data mining, forecasting, simulation, and predictive modeling, was also required.
Example 3: Aledade sought a Business Intelligence Data Analyst to provide continuous analytical support, using operational and clinical data to address pressing business questions, support data operations, and project management functions. This role would be a part of the Business Intelligence team.
In each case, the analyst's responsibilities varied, such as:
- collecting and integrating health plan and internal systems data
- creating data visualization solutions
- examining trends, providing actionable insights, and supporting stakeholders with operational and clinical data analysis
Other key responsibilities of the Data Analyst included:
- Developing actionable roadmaps for workflows and processes
- Setting up and organizing KPIs and timelines for deliverables aligned with team objectives
- Building interactive dashboards, reports, and data visualizations to effectively communicate insights from data and drive action
- Assisting in the design and implementation of data warehouse tables or views to support analysis and reporting
- Supporting the team in research, data analysis, meeting preparation, follow-through, and the development of strategies to address health disparities
- Proactively identifying and flagging major risks or challenges to draw attention, allocate resources, or implement mitigation steps
Example 4: Franciscan Health was seeking a Healthcare Business Data Analyst with the following functions:
- Identifying and proposing evaluation strategies for key performance indicators (KPIs), quality metrics, outcomes, population management studies, and other relevant areas
- Developing technical and functional specifications based on business requirements and workflow analysis
- Managing database processing functions, such as merge/purge, data hygiene, data appends, and coordination with business partners
- Identifying and addressing data quality issues that may affect reporting, such as duplicate records or missing data
- Utilizing appropriate programming languages and technologies to extract and process data for business analytics
- Identifying effective methods of data visualization and presentation to communicate project findings to management
- Tracking and analyzing trends and relevant measures to maximize database capabilities
- Integrating add-on programs to optimize back-end processes
- Acting as a liaison between the analytical needs of departments and business partners
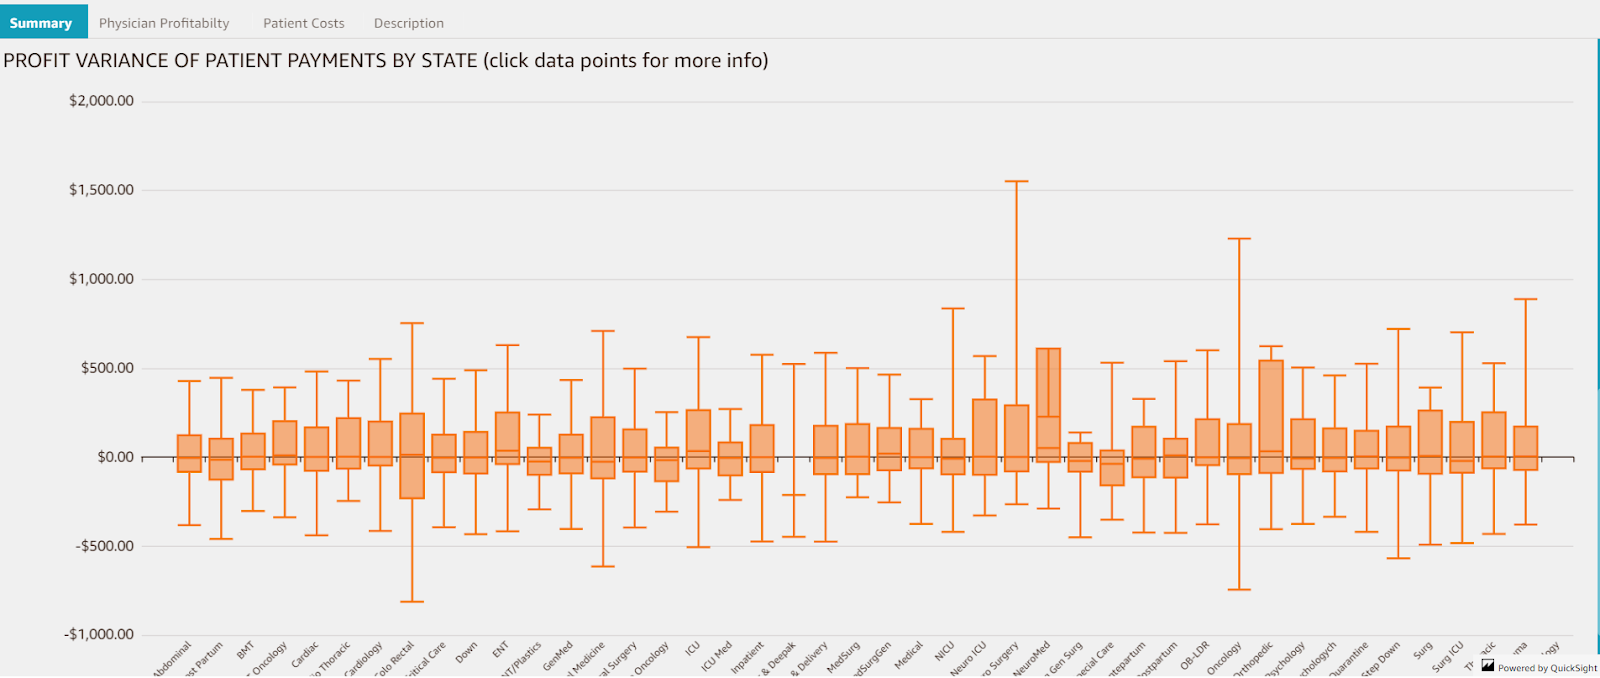
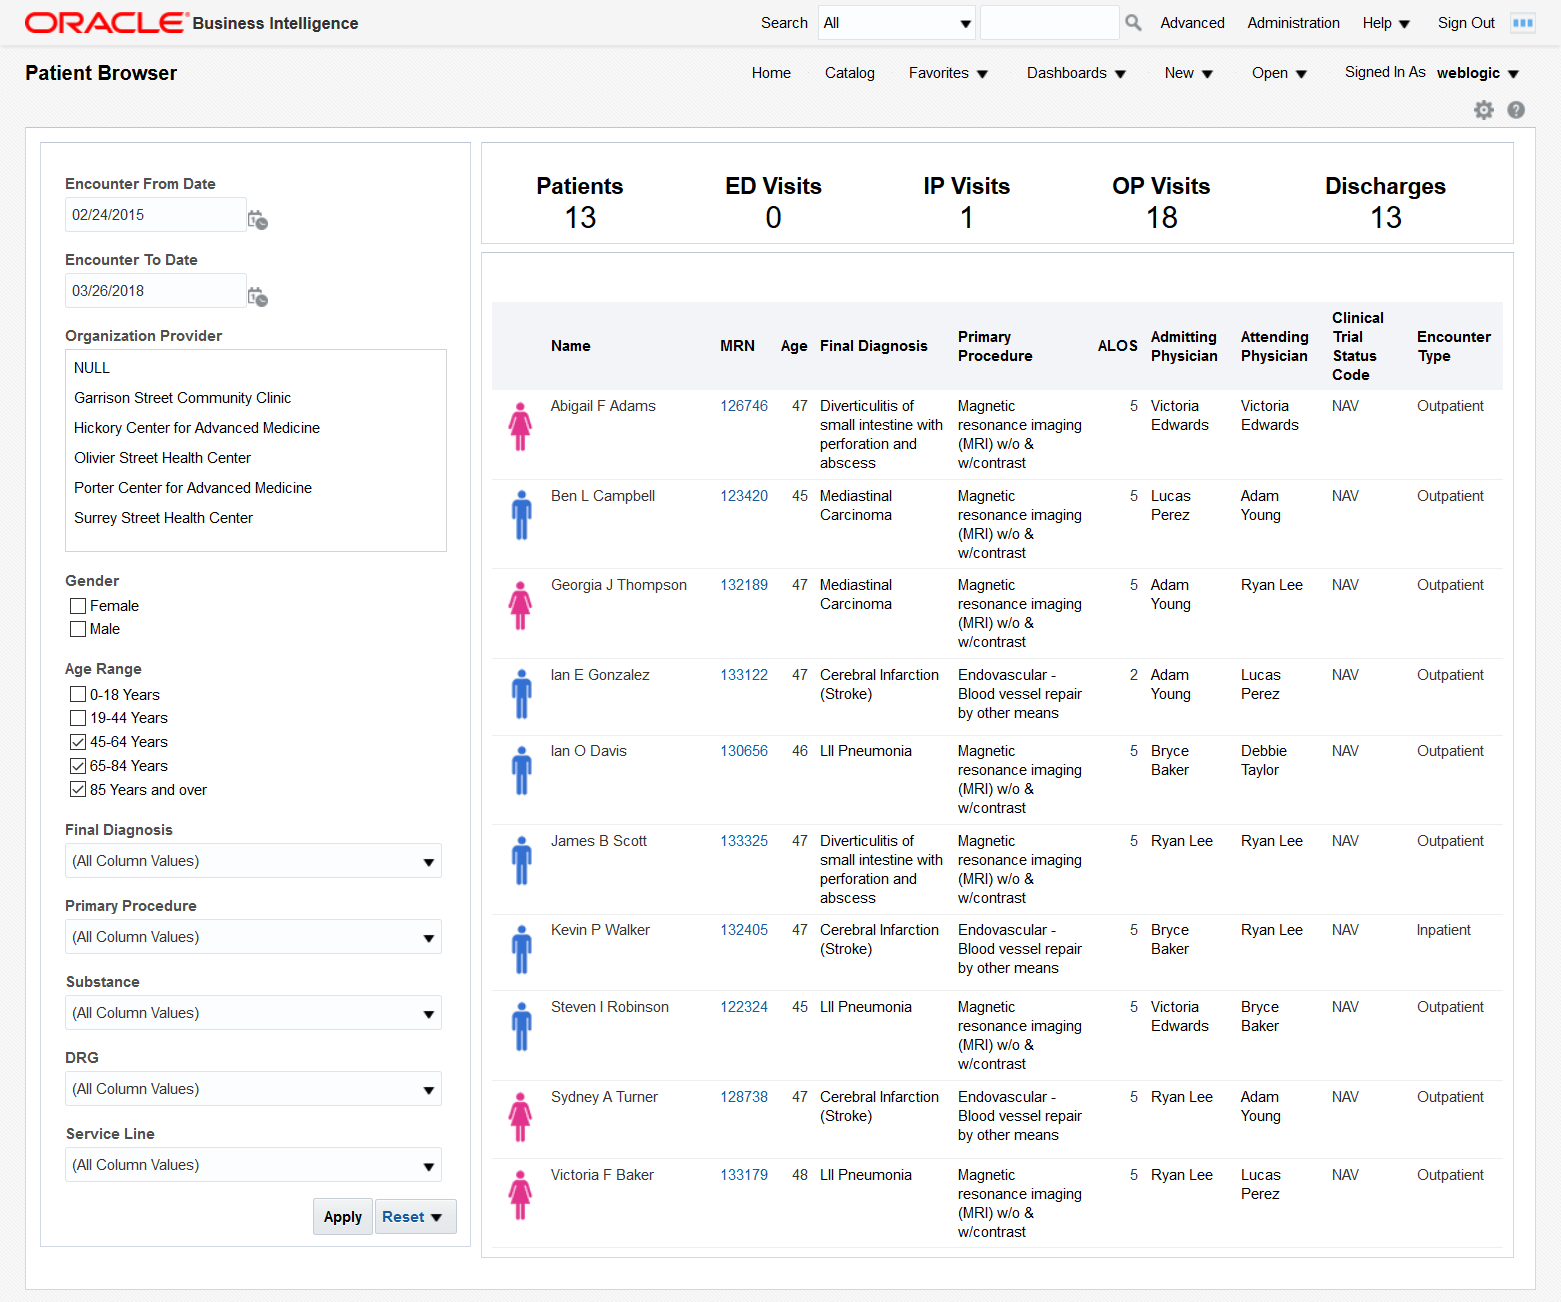
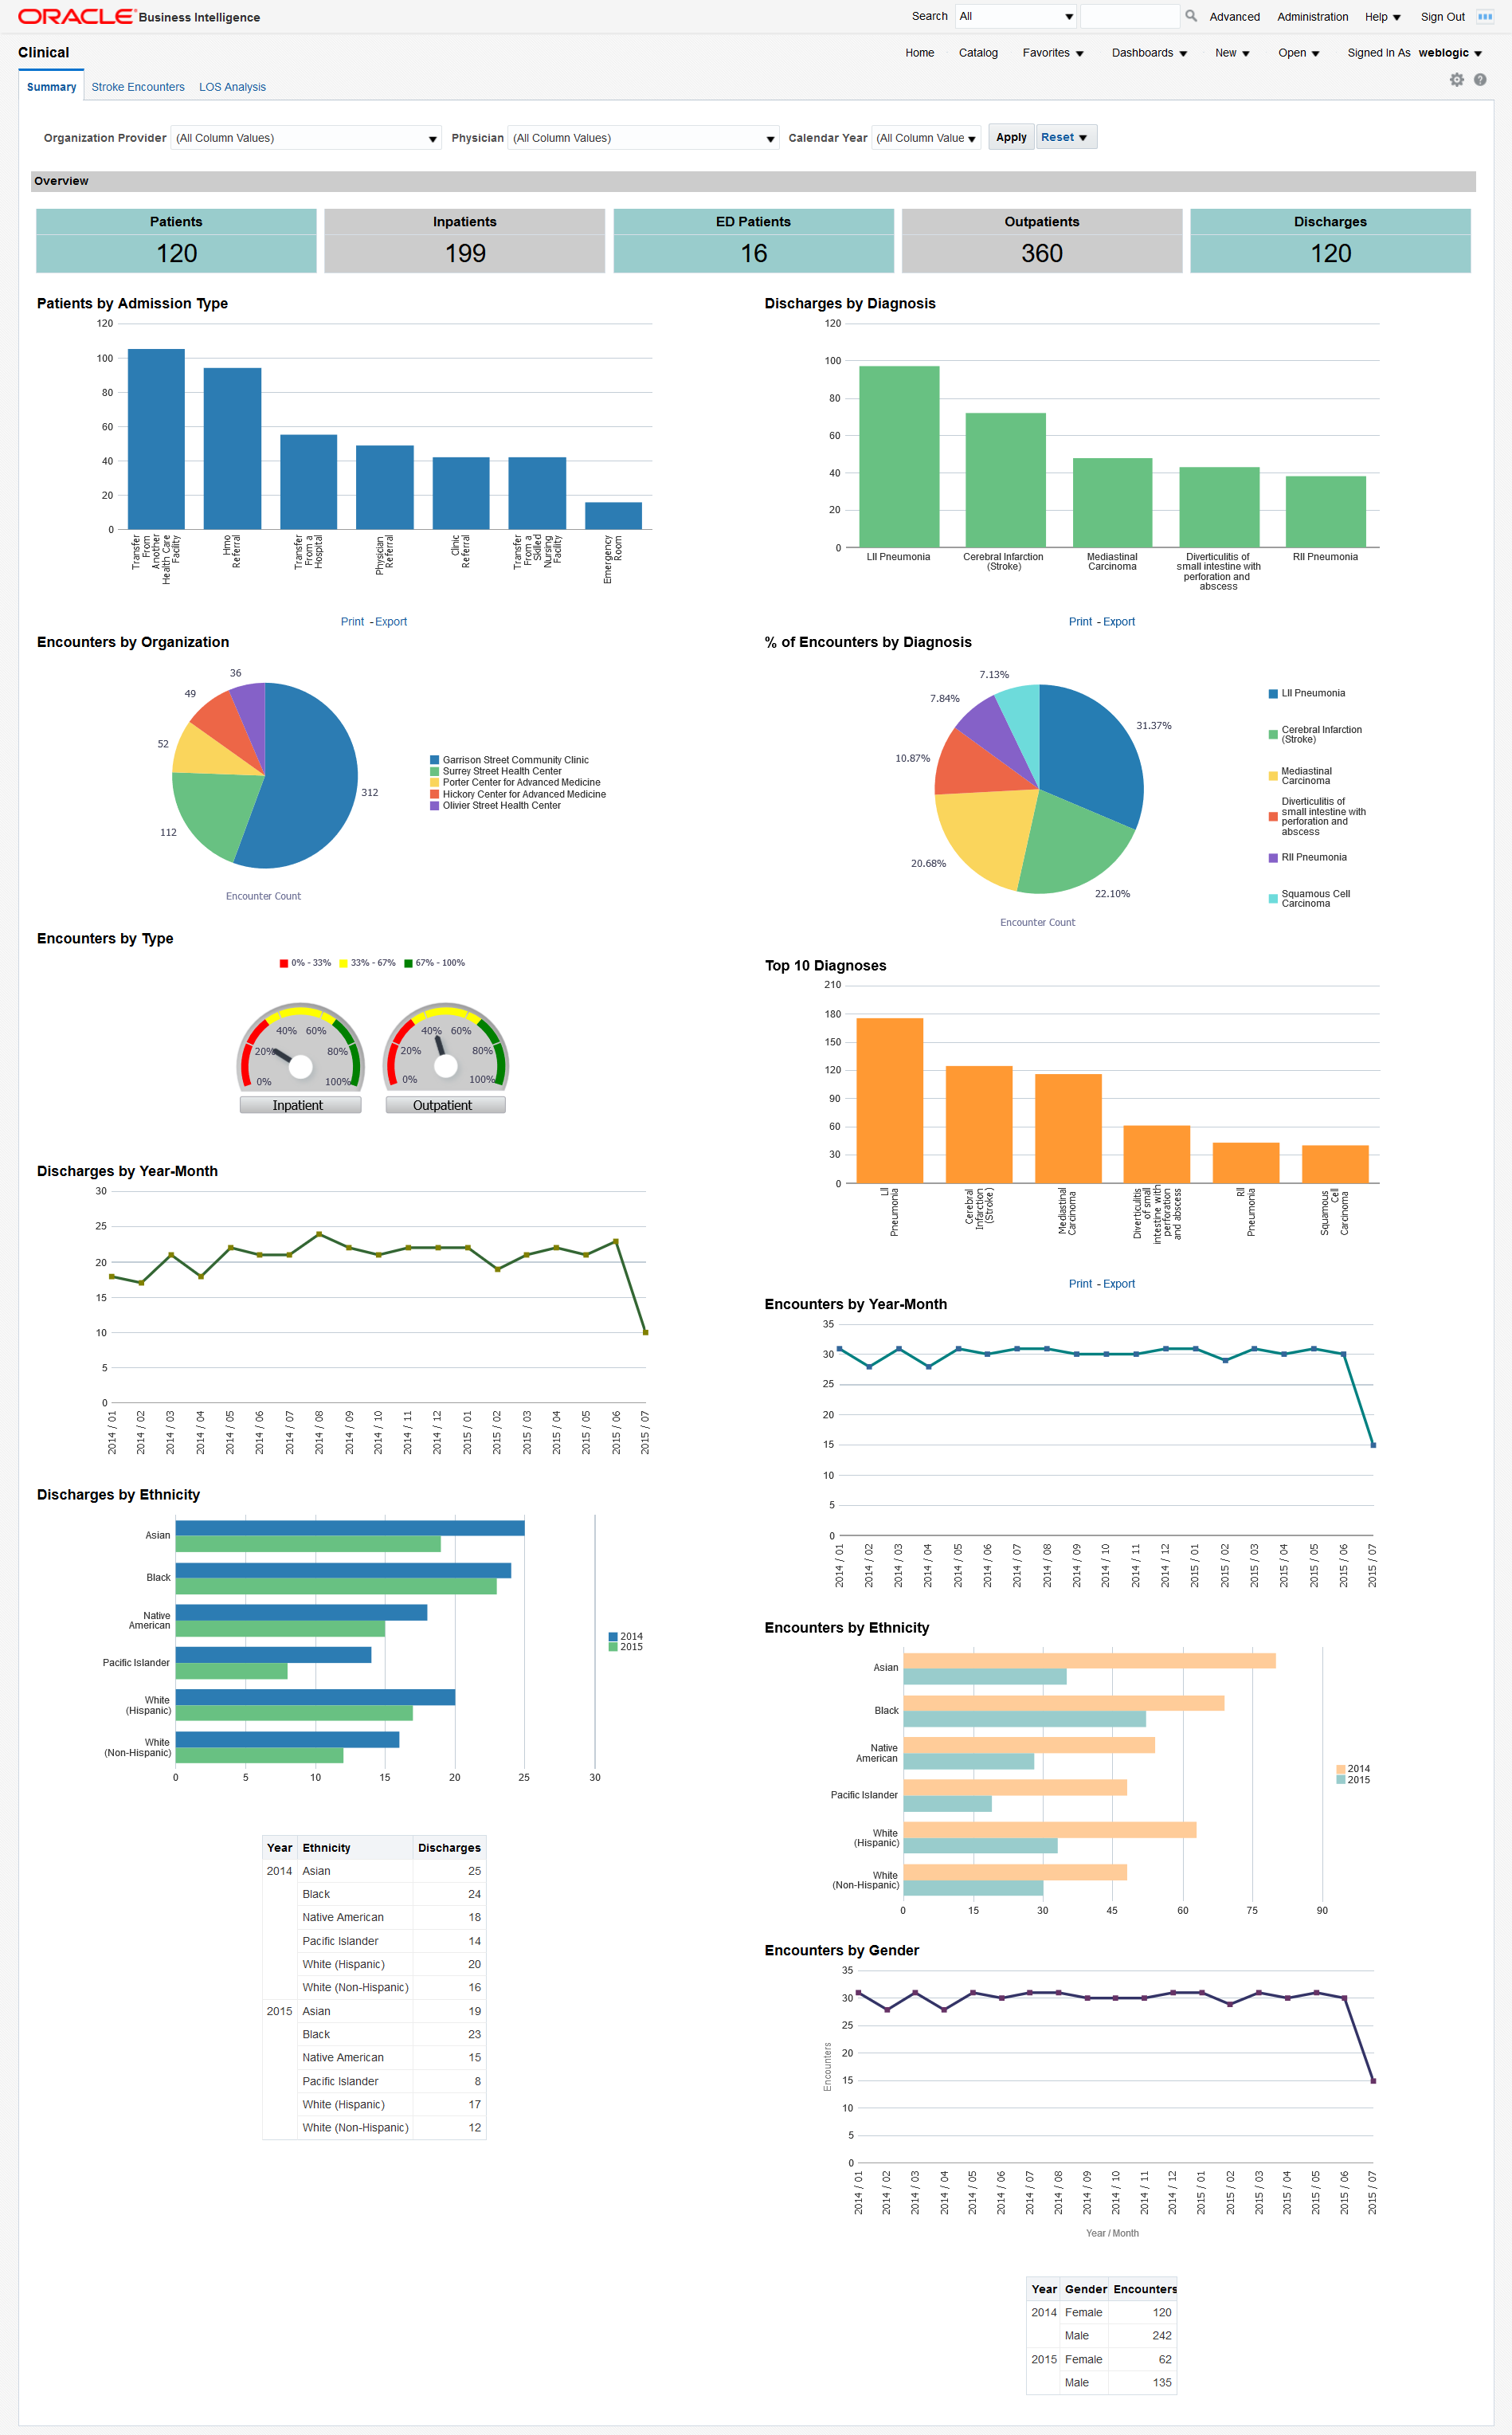
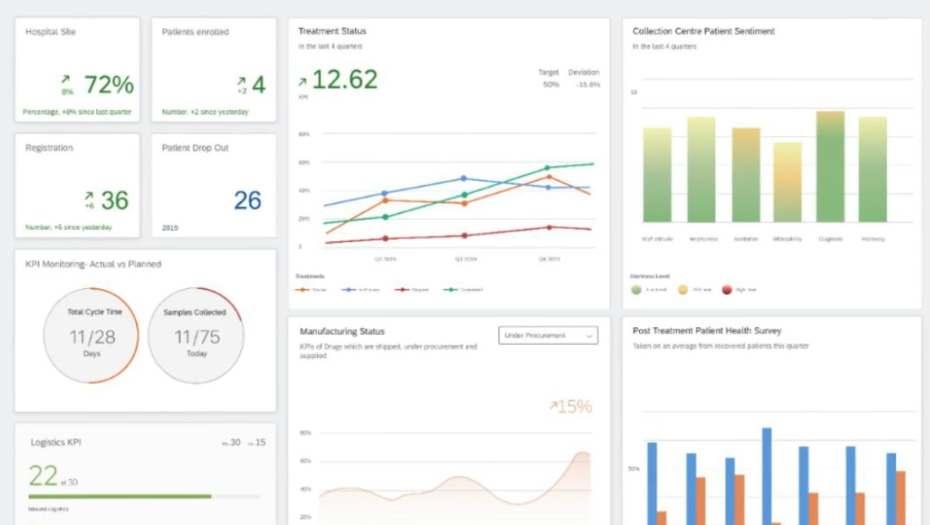
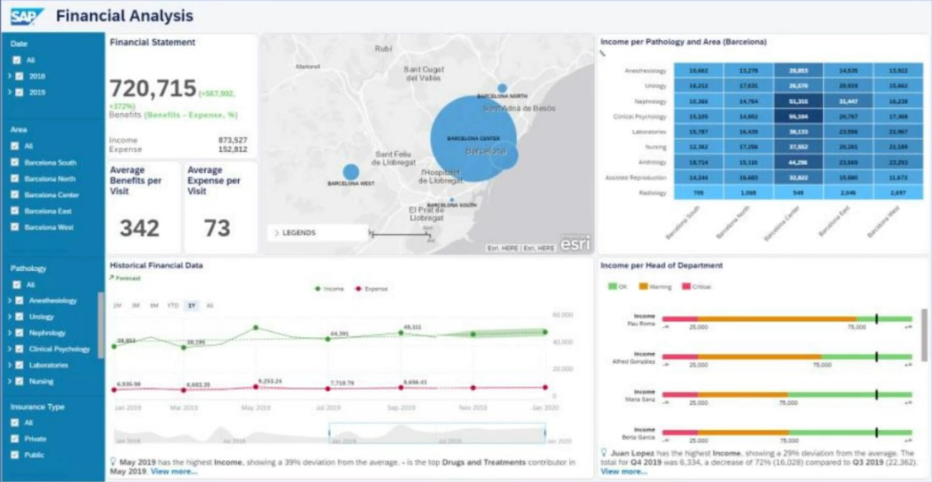
Business Intelligence Dashboards for Healthcare
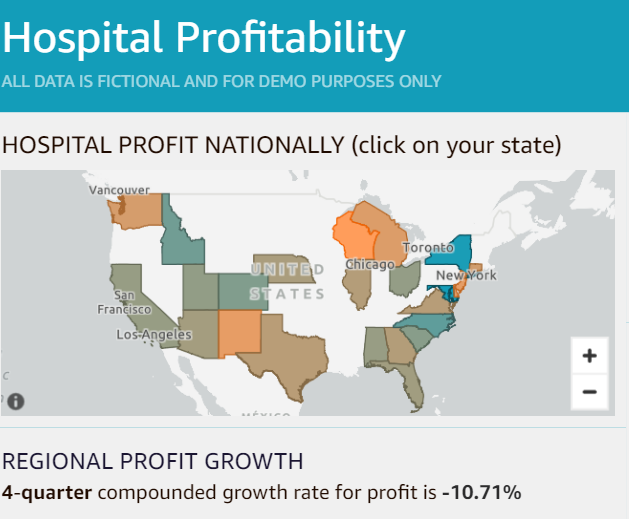
Healthcare dashboards allow healthcare organizations, including providers and payers, to gain deeper insights into their data by drilling into trends and Key Performance Indicators (KPIs) related to patients, providers, operational departments, clinical records, and finance. A healthcare dashboard offers users a real-time graphical display of their healthcare KPIs. It enables medical institutions to measure and compare metrics, such as patient satisfaction, physician allocation, Emergency Department Wait Times, and occupied bed count. This tool aids in improving operational efficiency, resulting in better outcomes and more intelligent decisions.
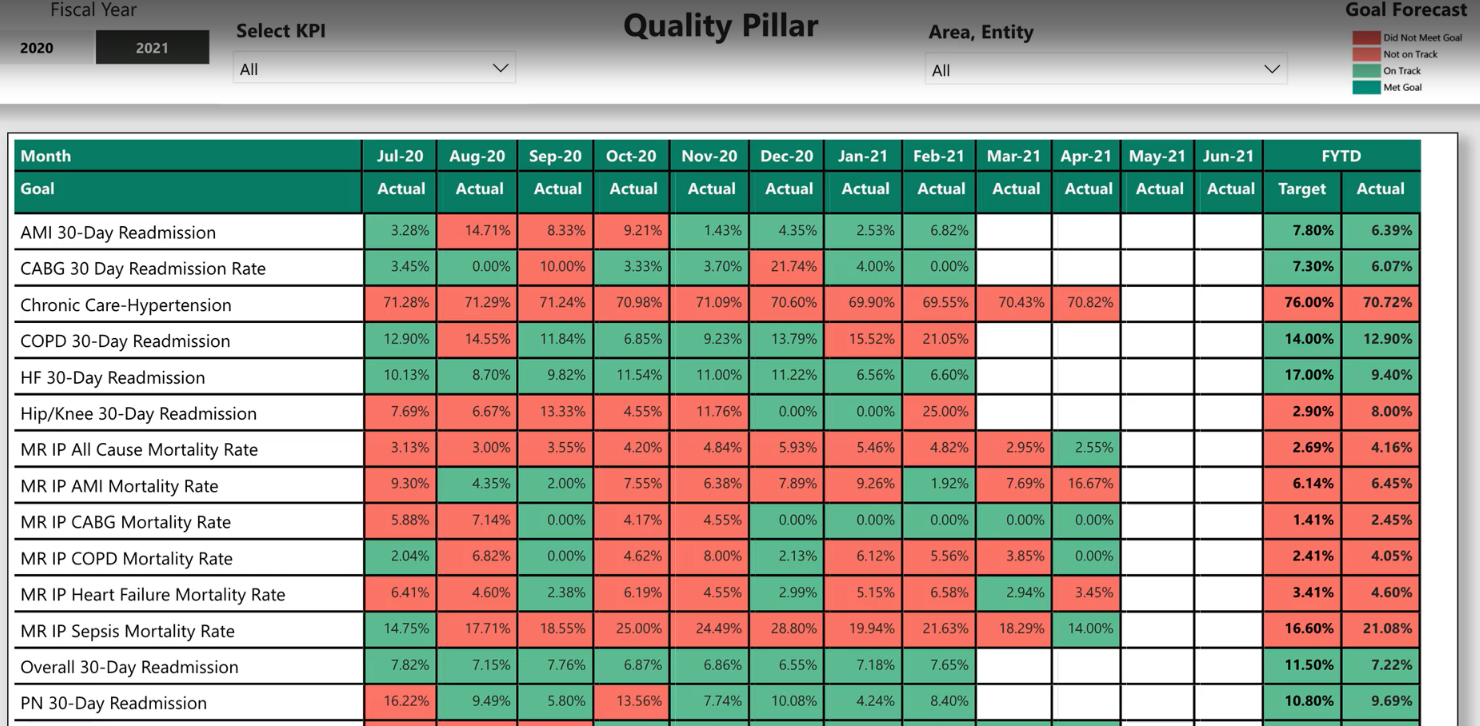
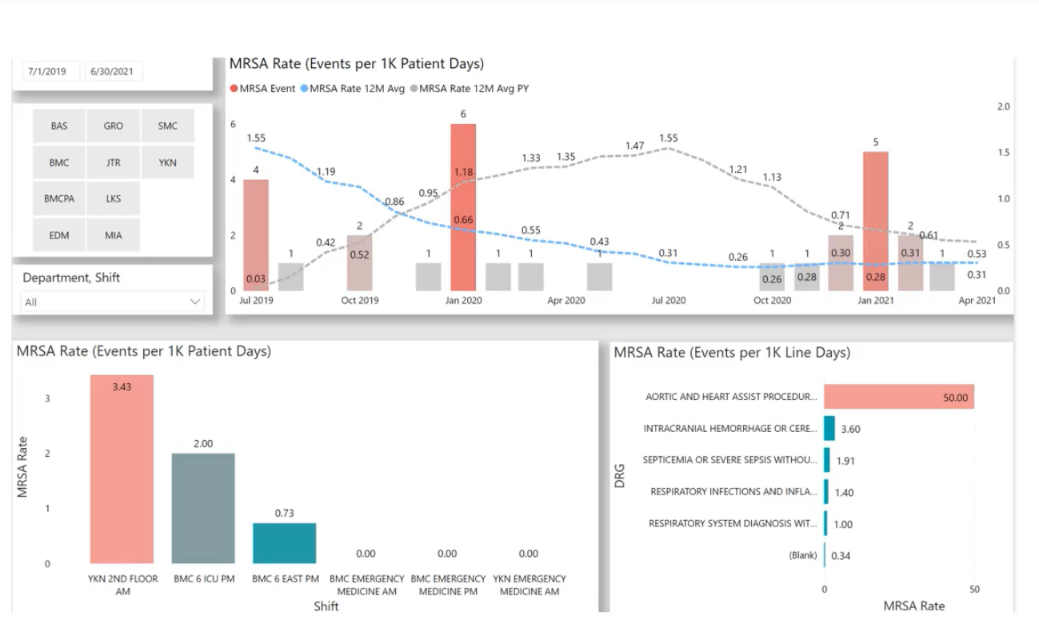
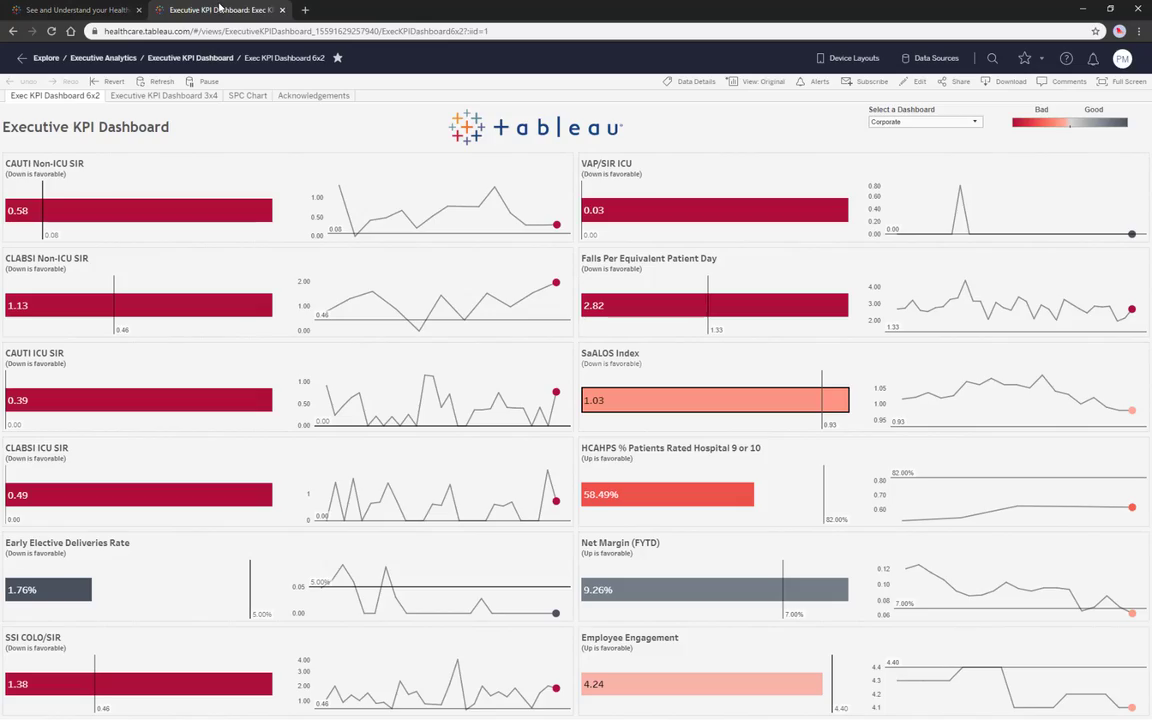
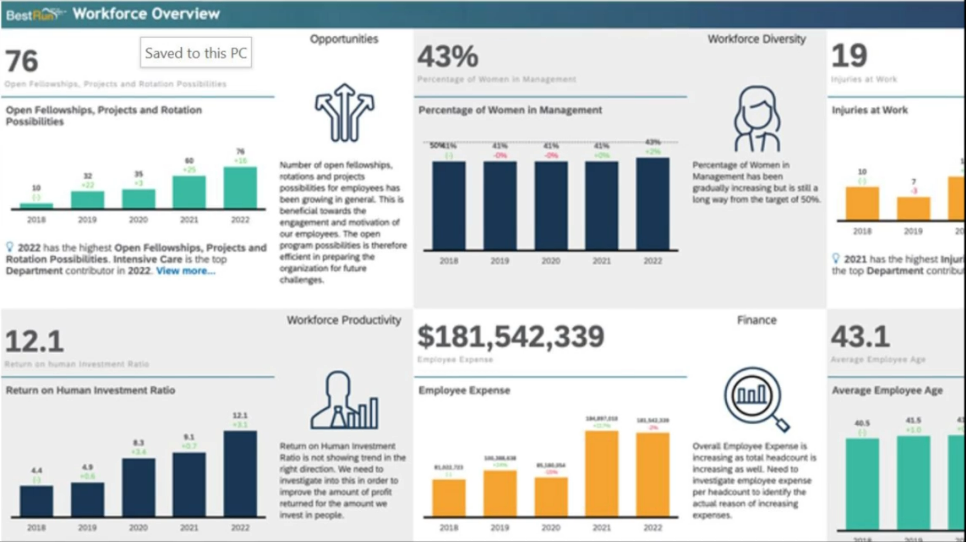
Executive KPI Dashboard
Many measures are now publicly reported, many of which are directly linked to reimbursement and are critical. It's challenging to prioritize what to work on next and respond to constantly changing needs while having fixed resources to improve patient experience, reduce the cost of care, and improve population health.
The Executive KPI Dashboard quickly displays critical KPIs. It is vital to understand the performance clearly and focus the efforts on where it's possible to maximize returns.
This dashboard accelerates information sharing and provides a scaffolding to automate the collection of critical data elements and unify analytics across multiple platforms.
The Executive KPI Dashboard accomplishes this by using a consistent, simple, and easy-to-understand visualization of the most critical measures. A quick glance at the dashboard shows the state of dozens of KPIs, including the number on each bar, performance against the benchmark, trend over time, and most recent performance. Users can drill down to a linked dashboard to learn more or access reference material, such as an internal wiki page. Additionally, users can view performance through a statistical process control chart, with signals for particular cause variations automatically highlighted.
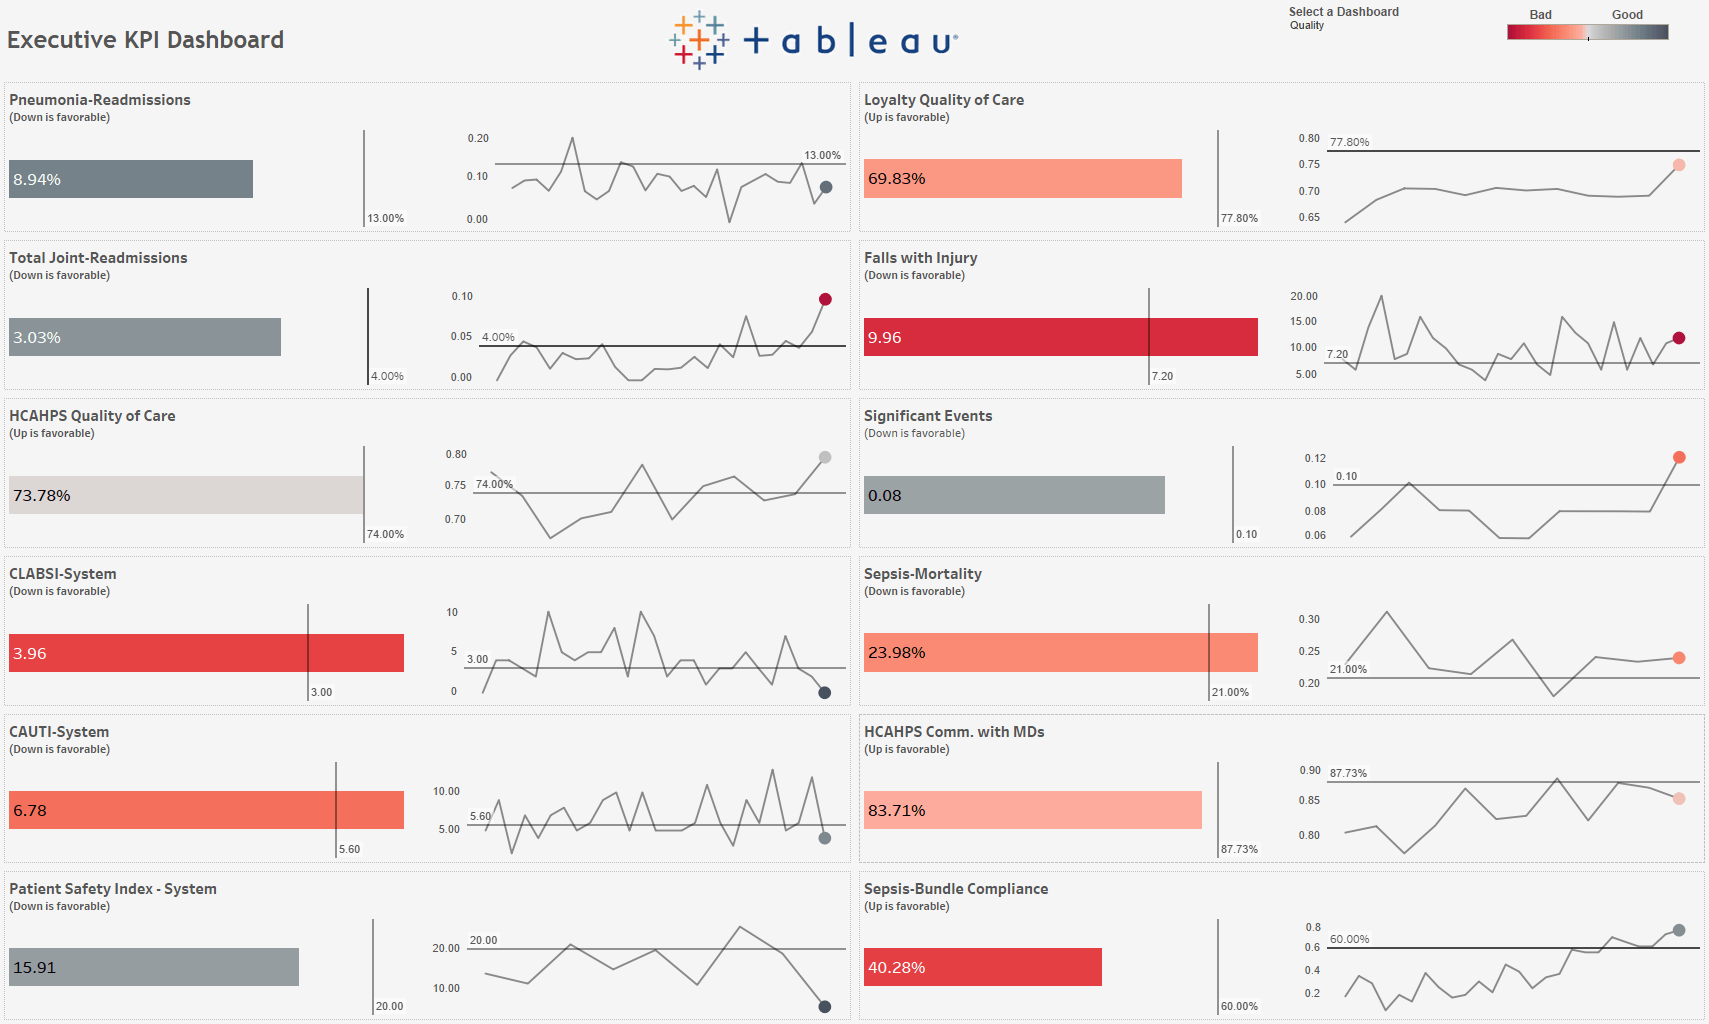
Executive KPI Dashboard. Tableau
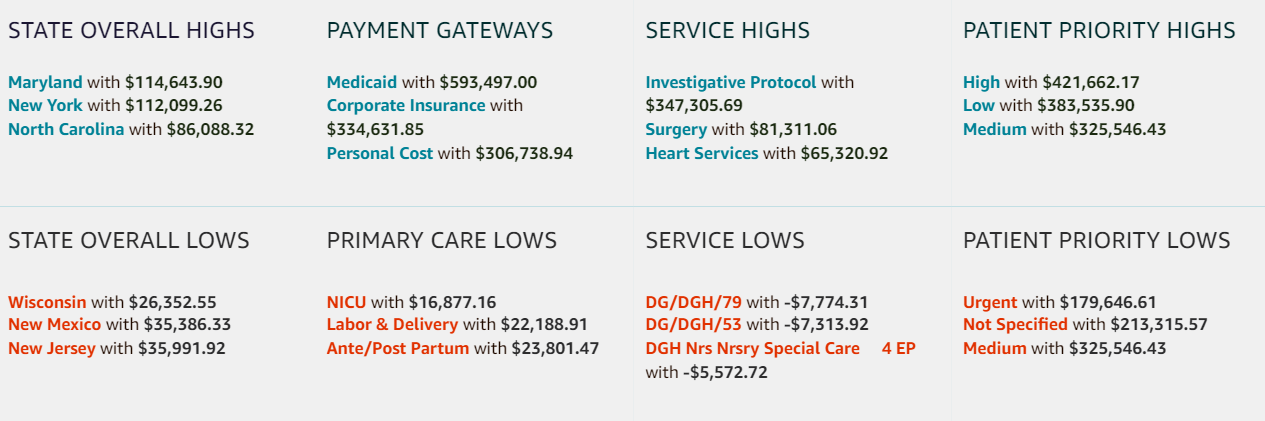
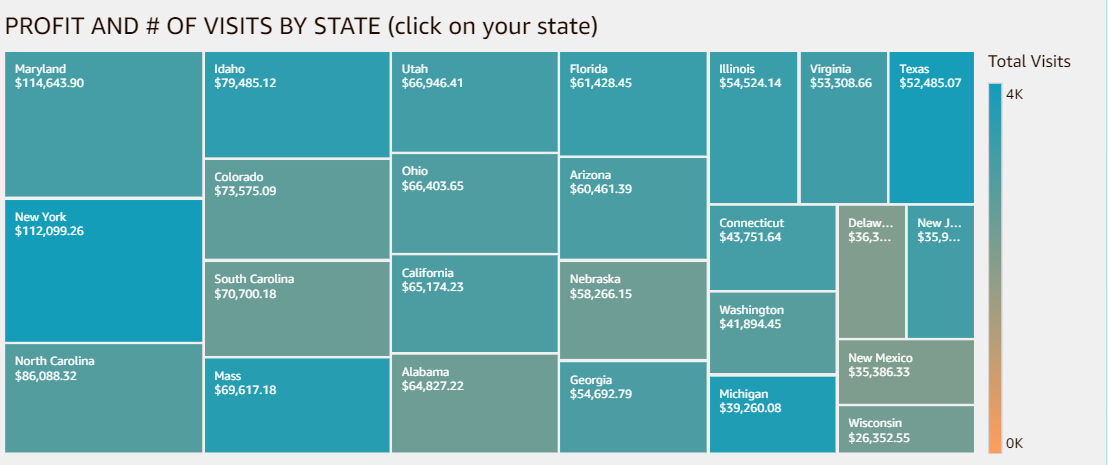
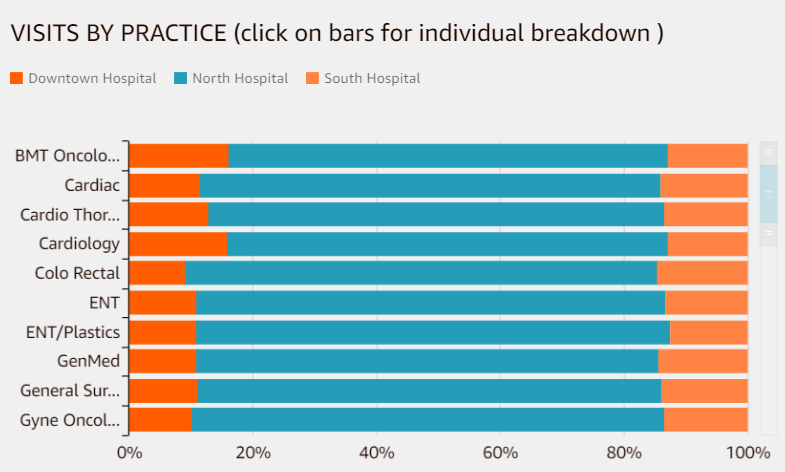
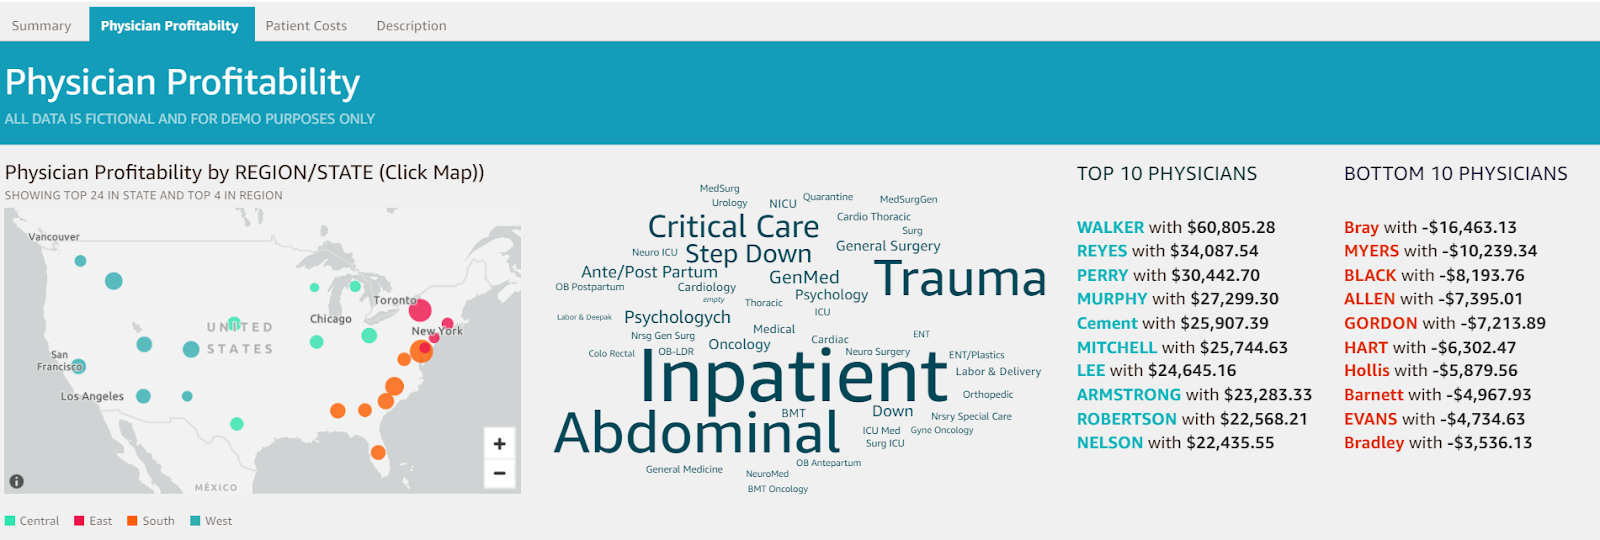
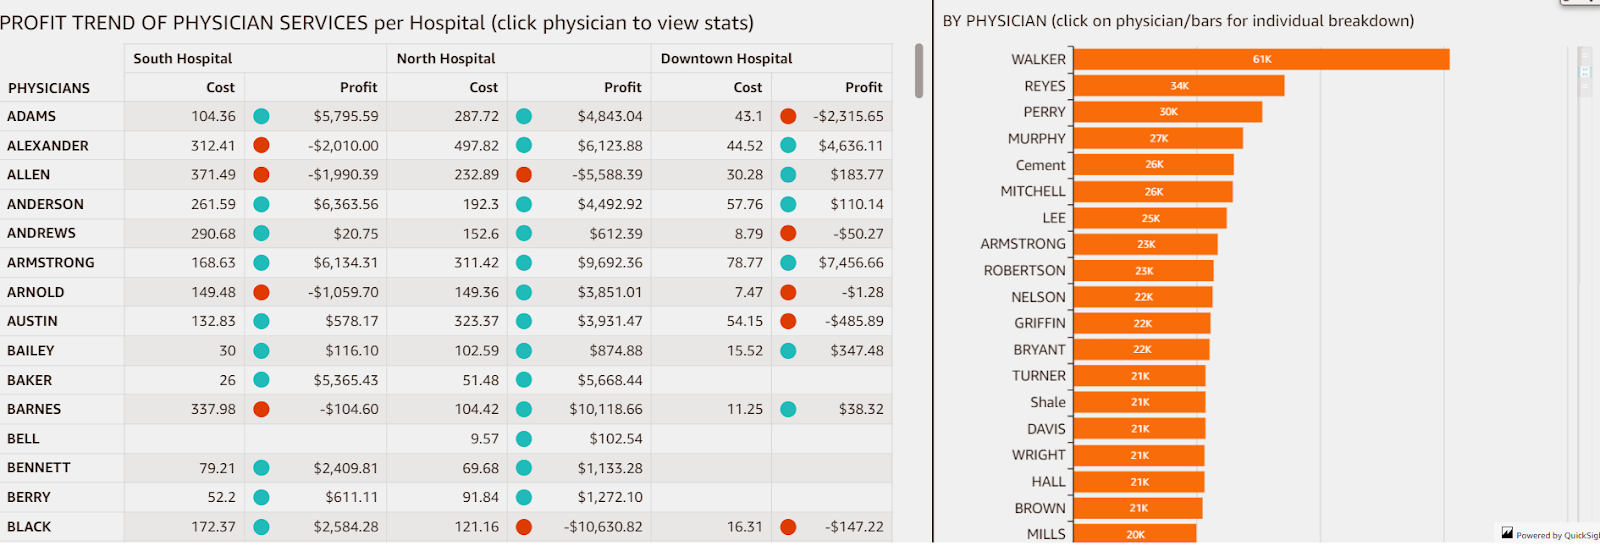
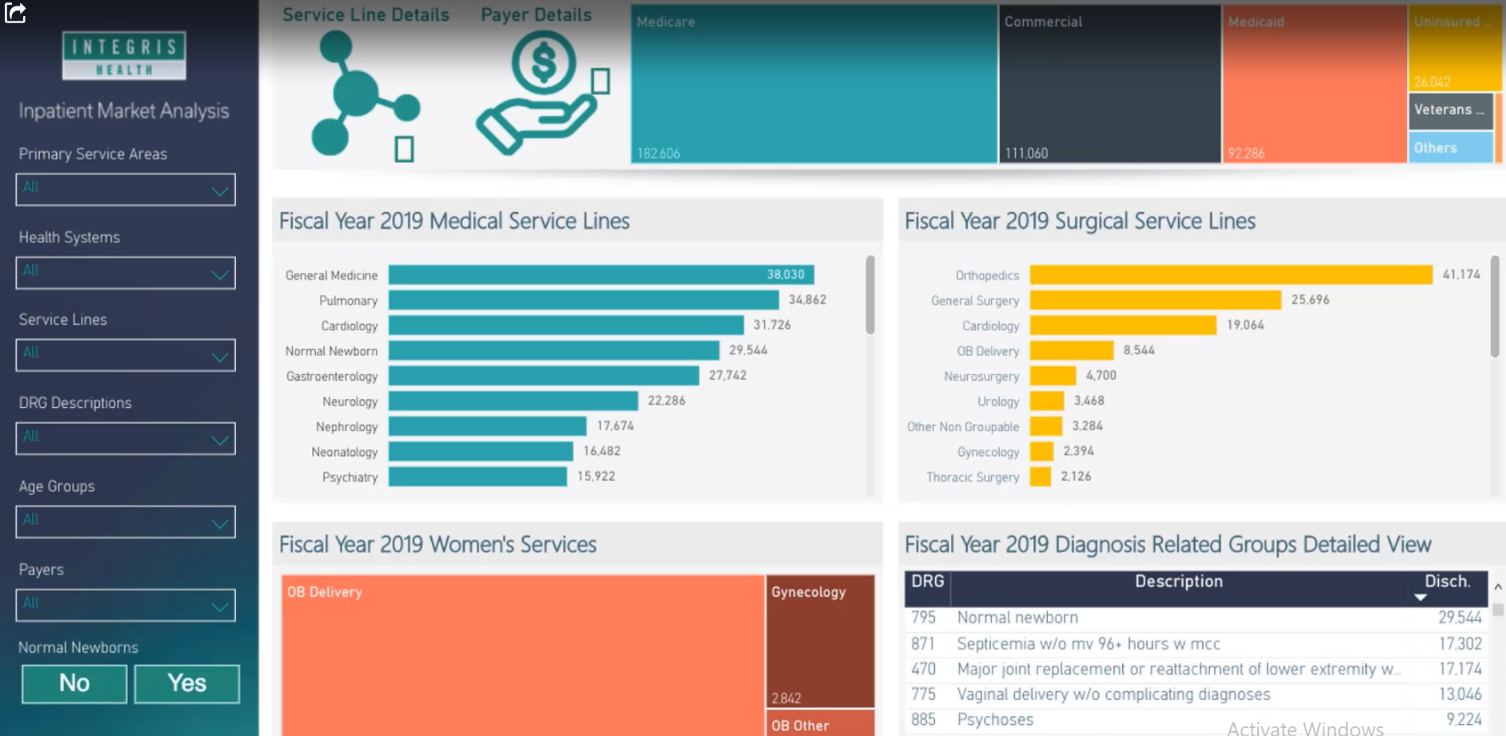
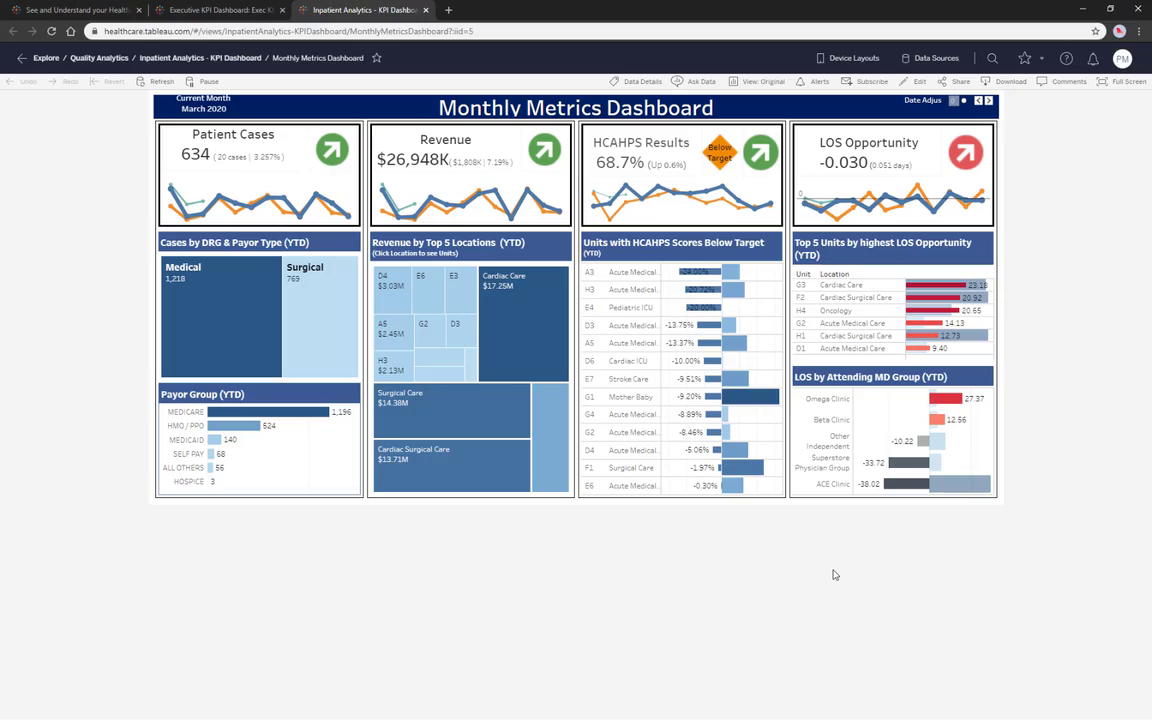
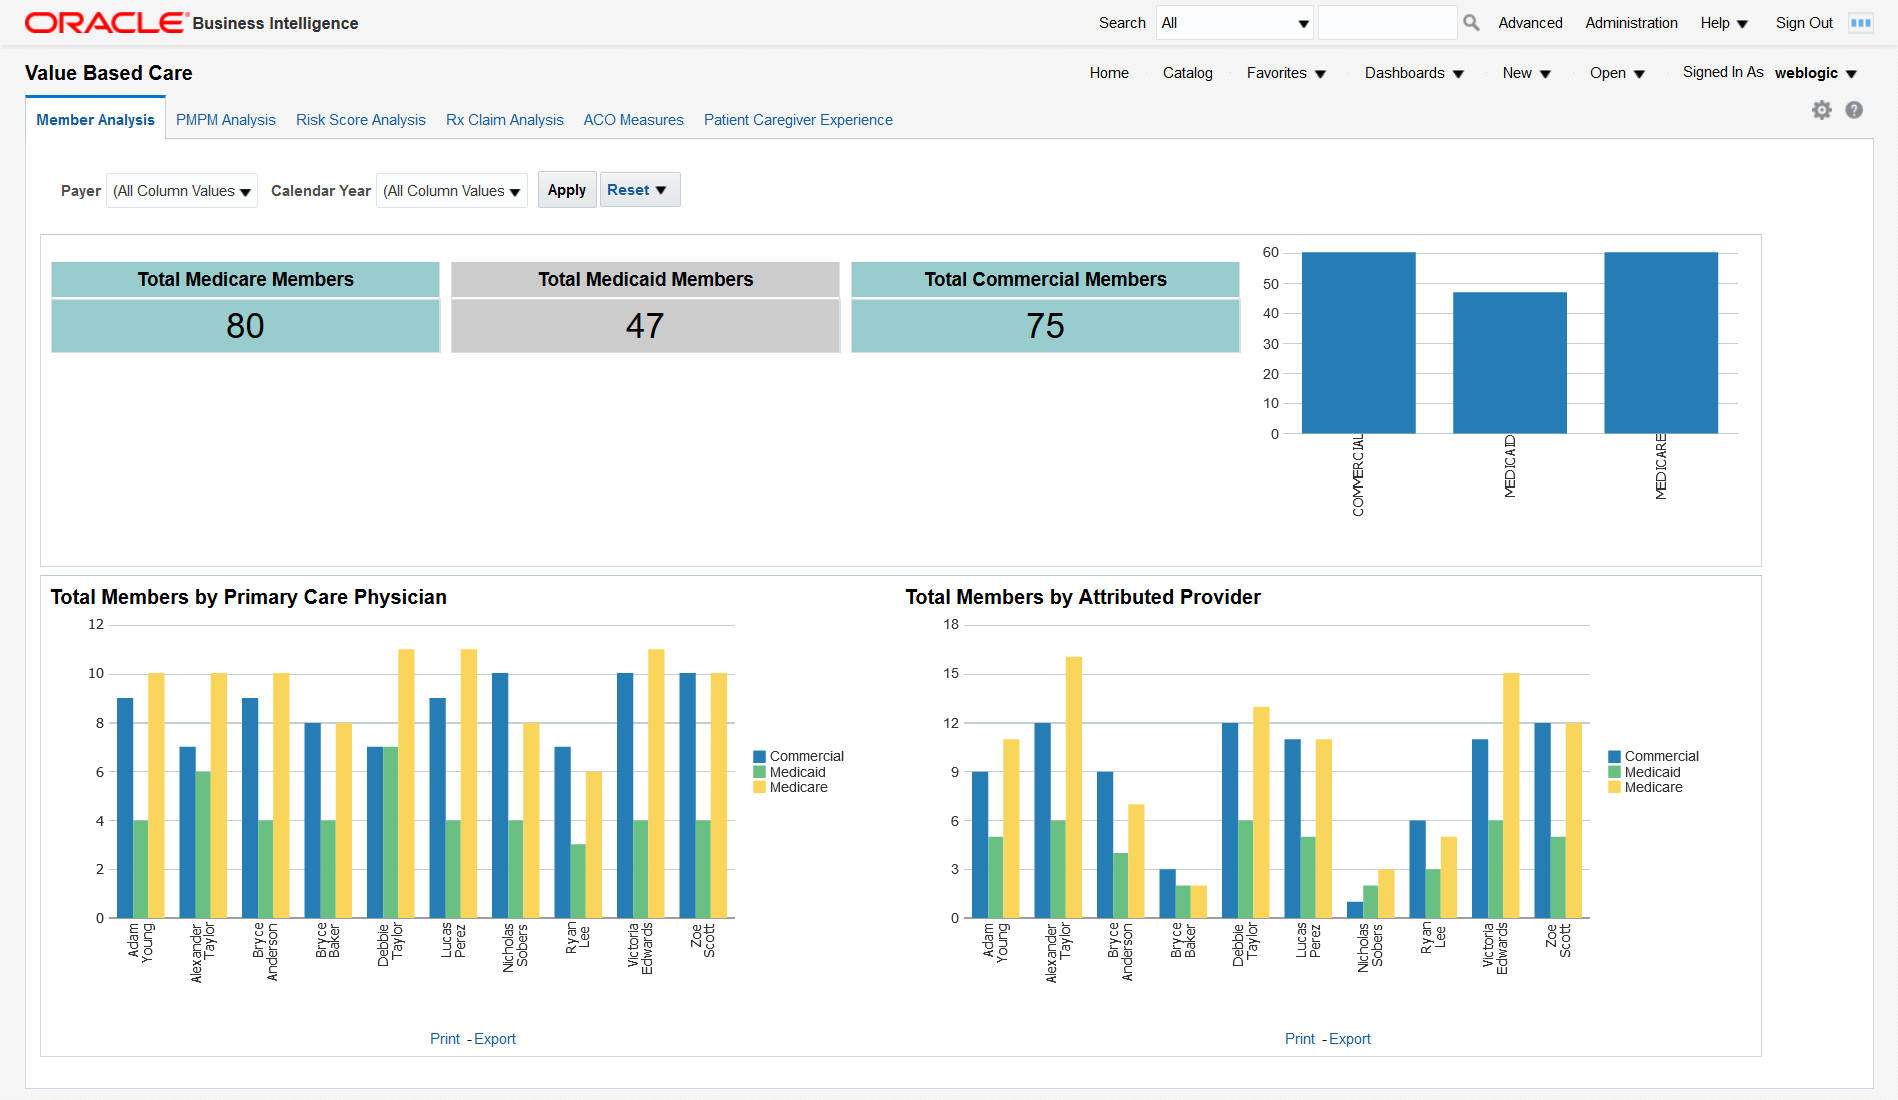
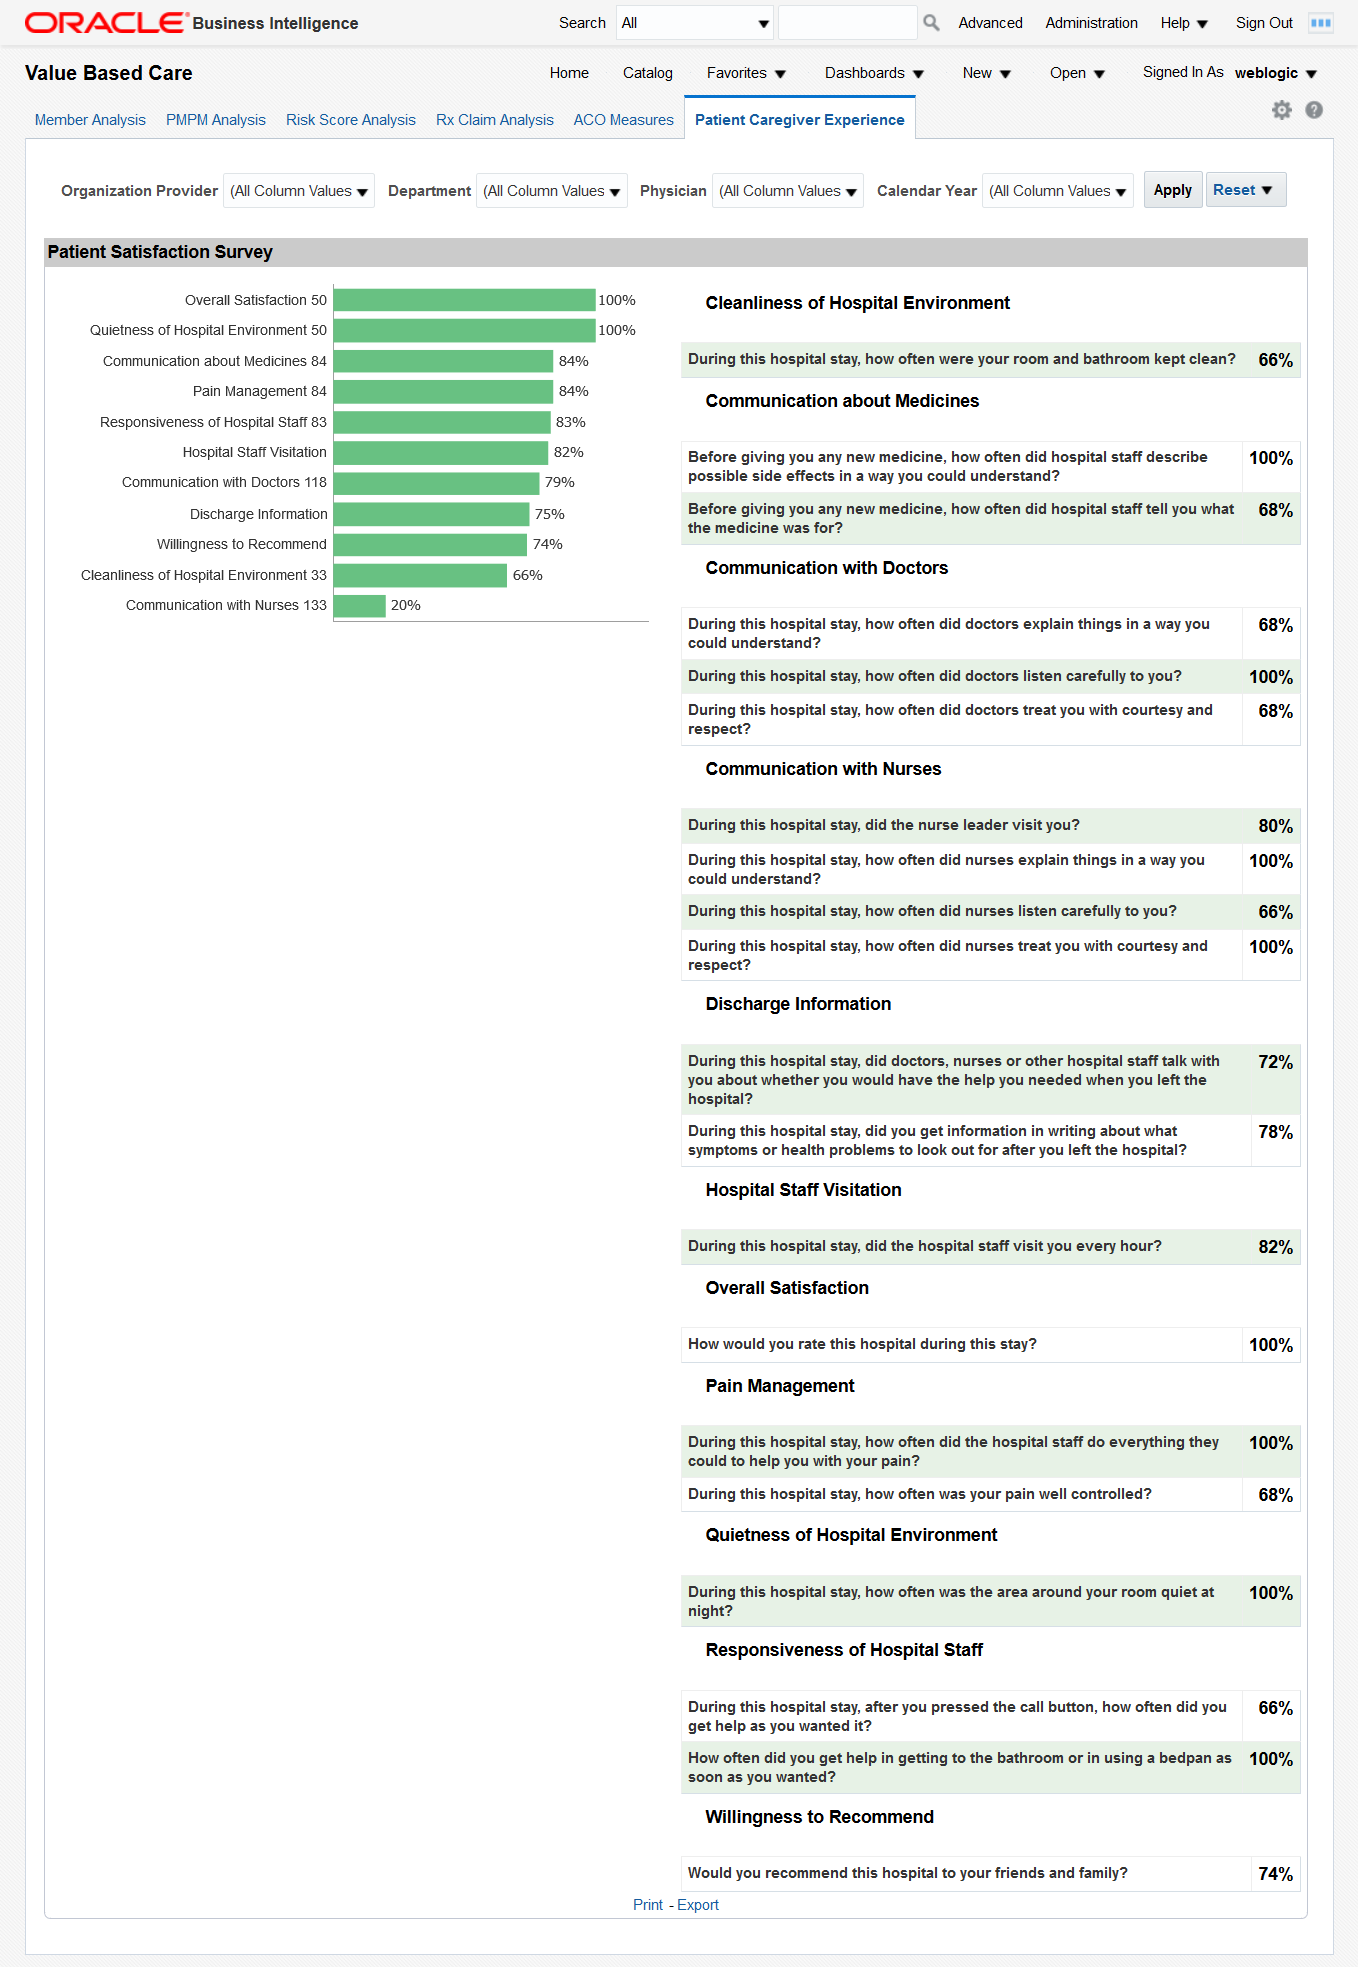
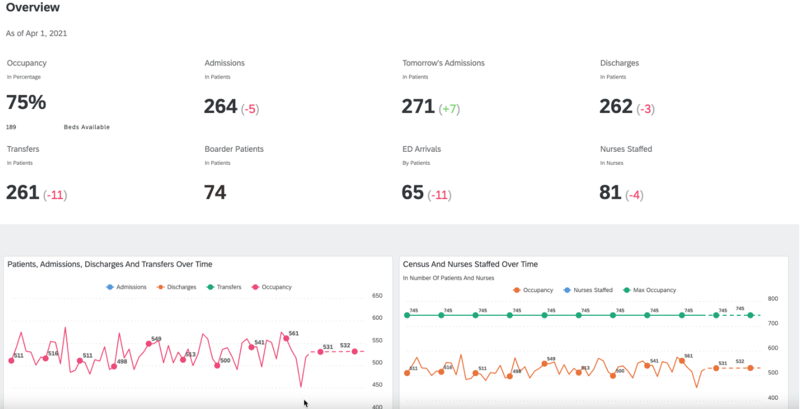
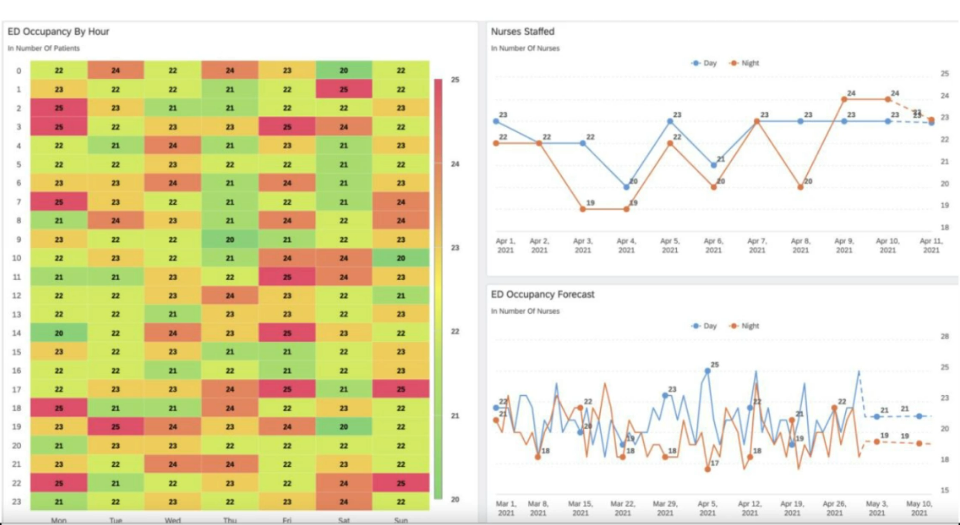
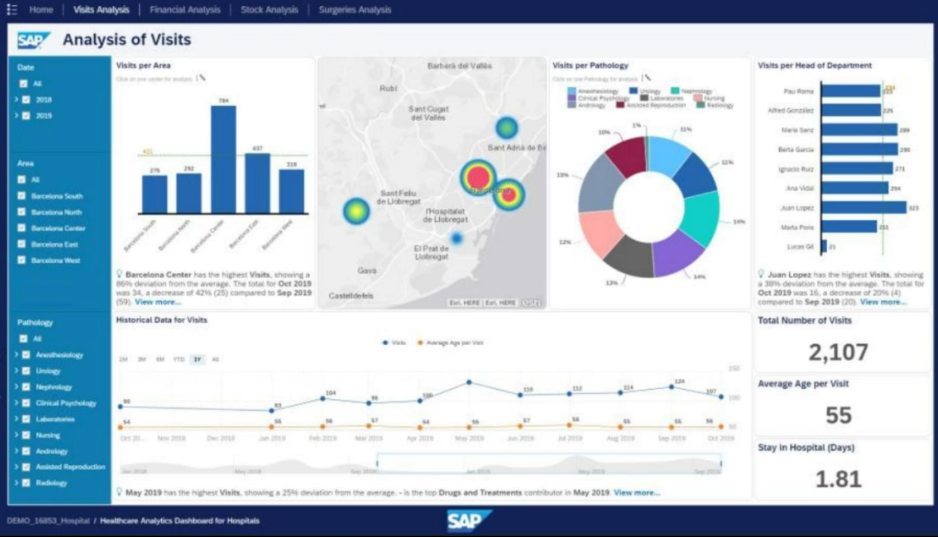
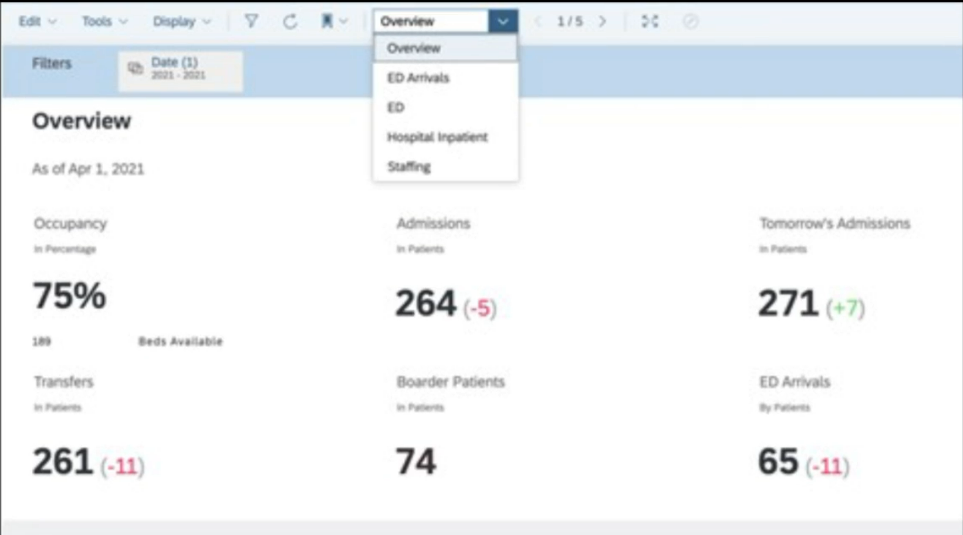
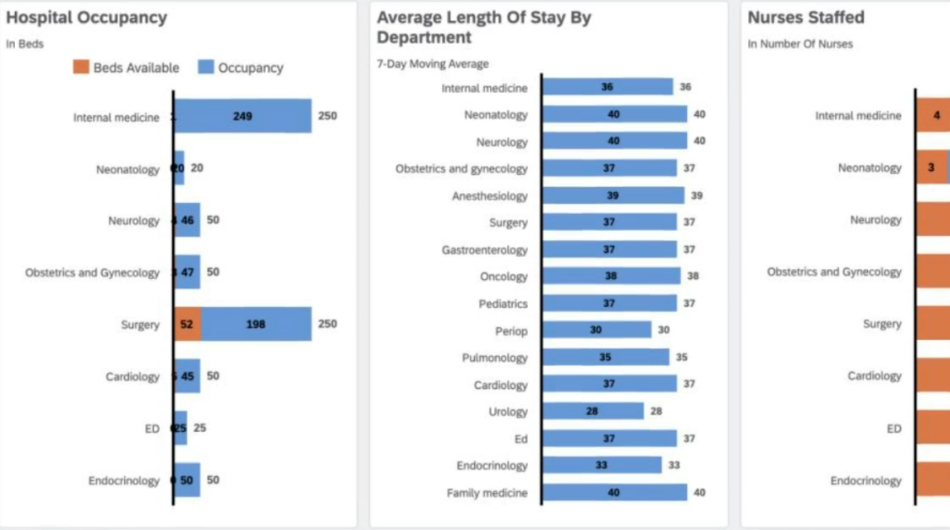
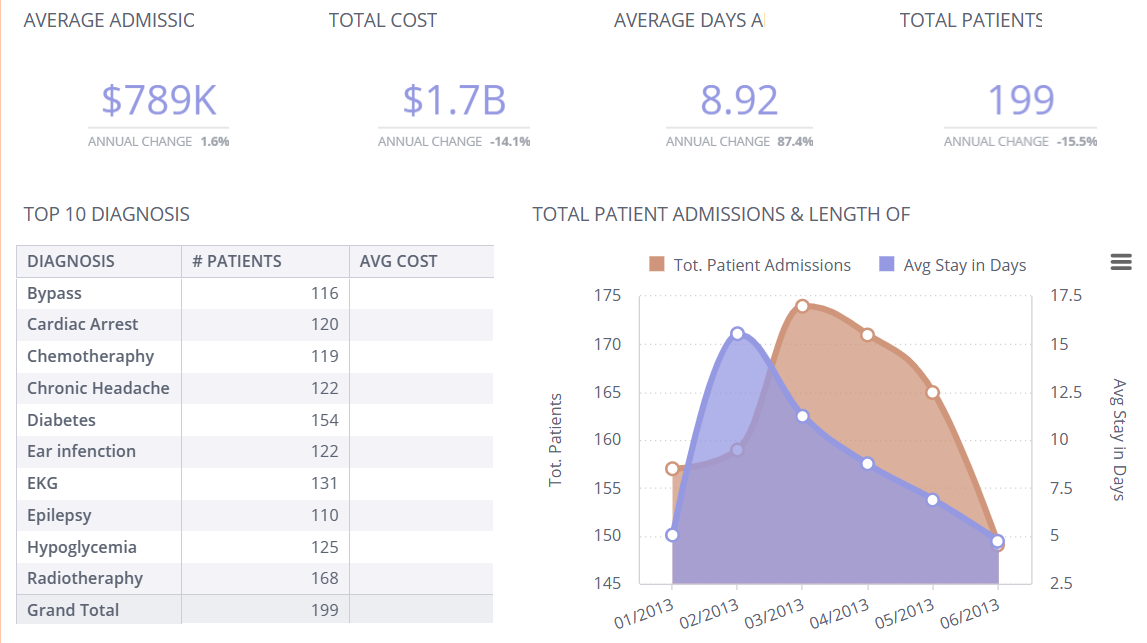
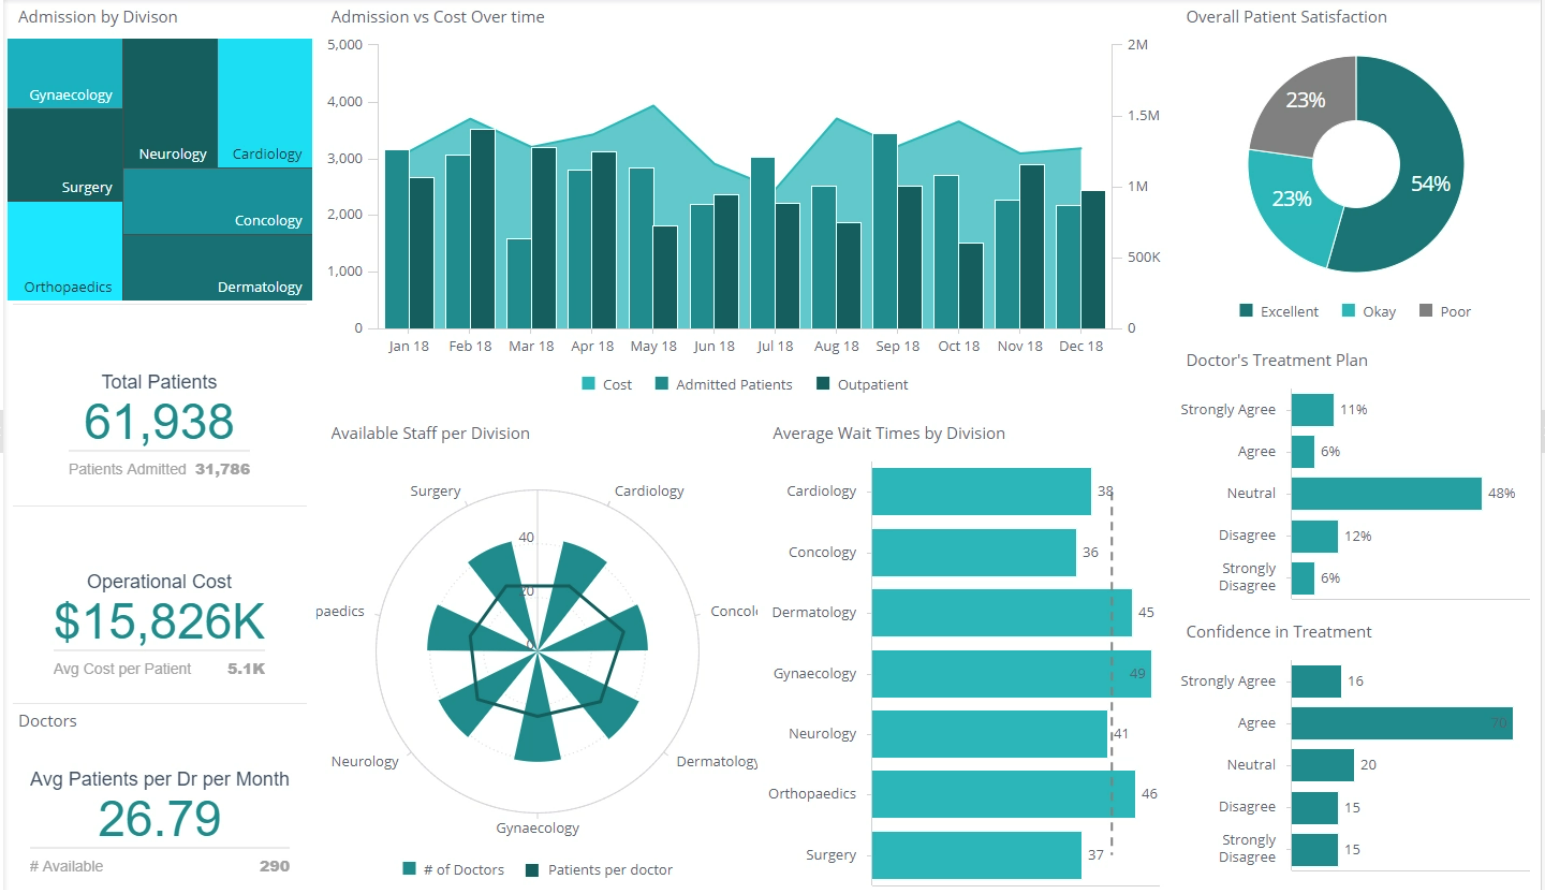
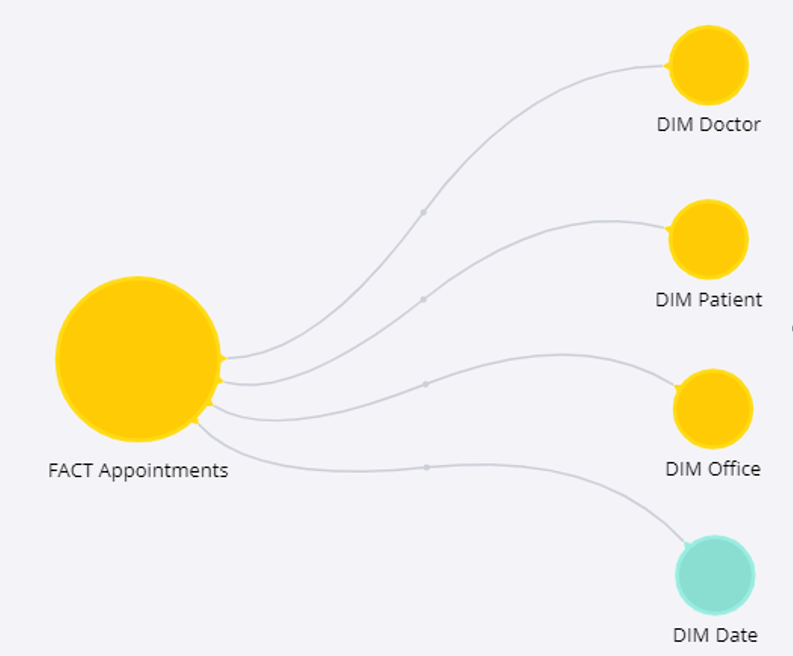
Hospital Performance Dashboards
The department can monitor a hospital's admissions, comparing the number of doctors and average wait time. Such monitoring can facilitate determining the necessary resources required to run each department.
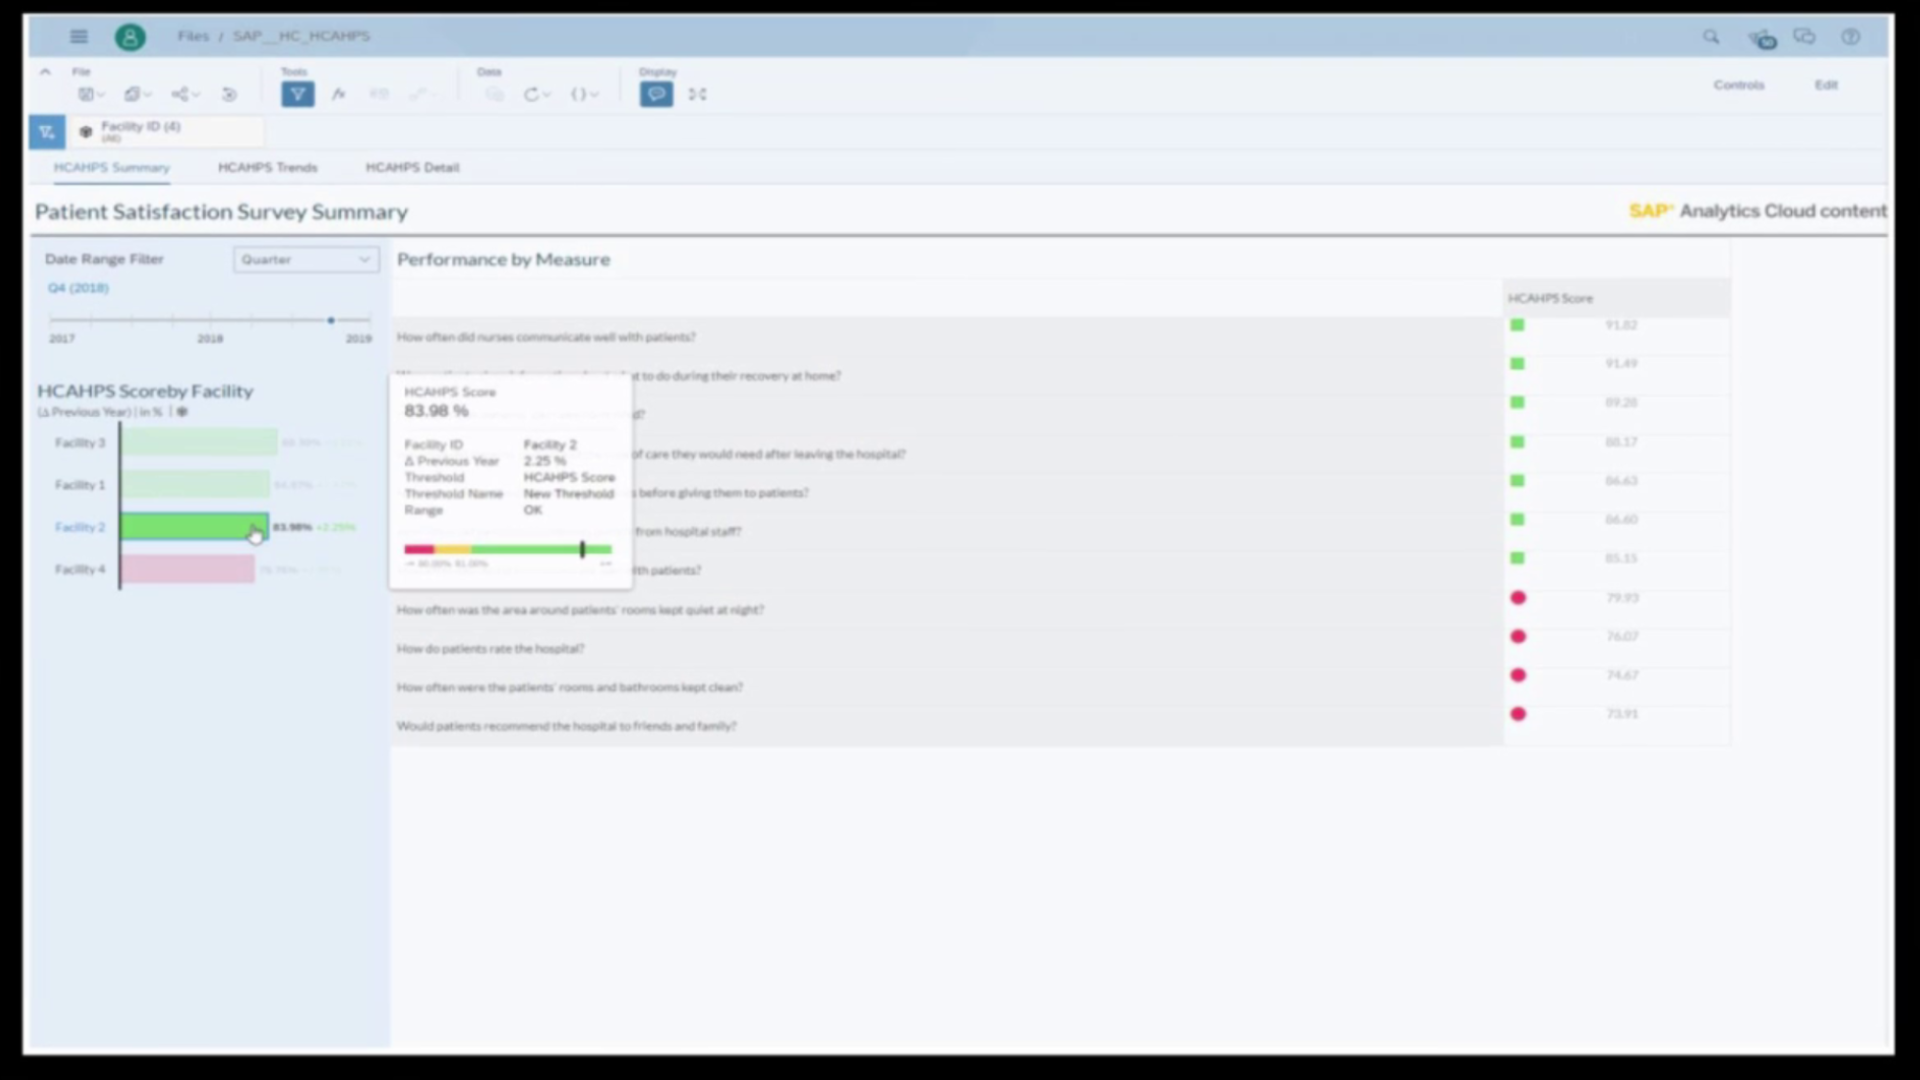
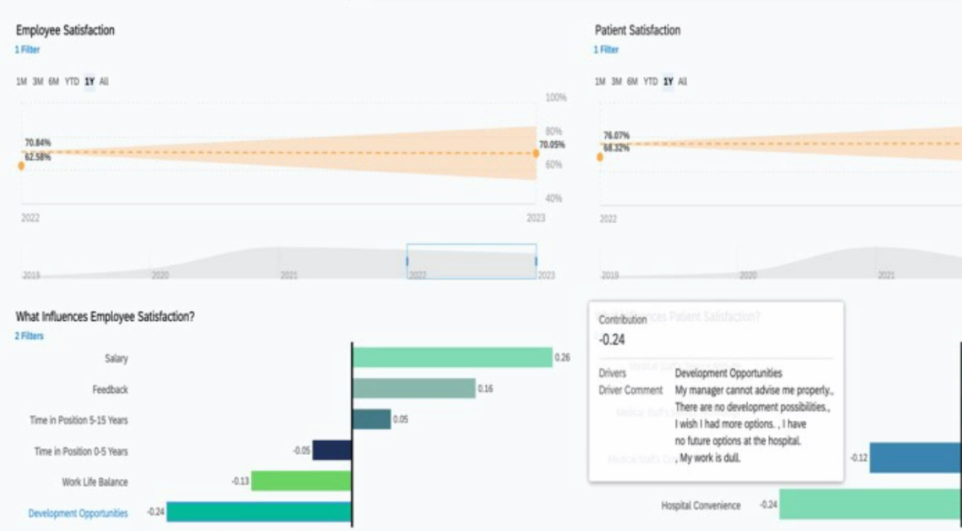
Additionally, tracking patient satisfaction provides a means to measure both the performance of doctors and the overall quality of each division.
Establishing a relationship between the user and the dimension allows control over which divisions are visible to which users due to security reasons.
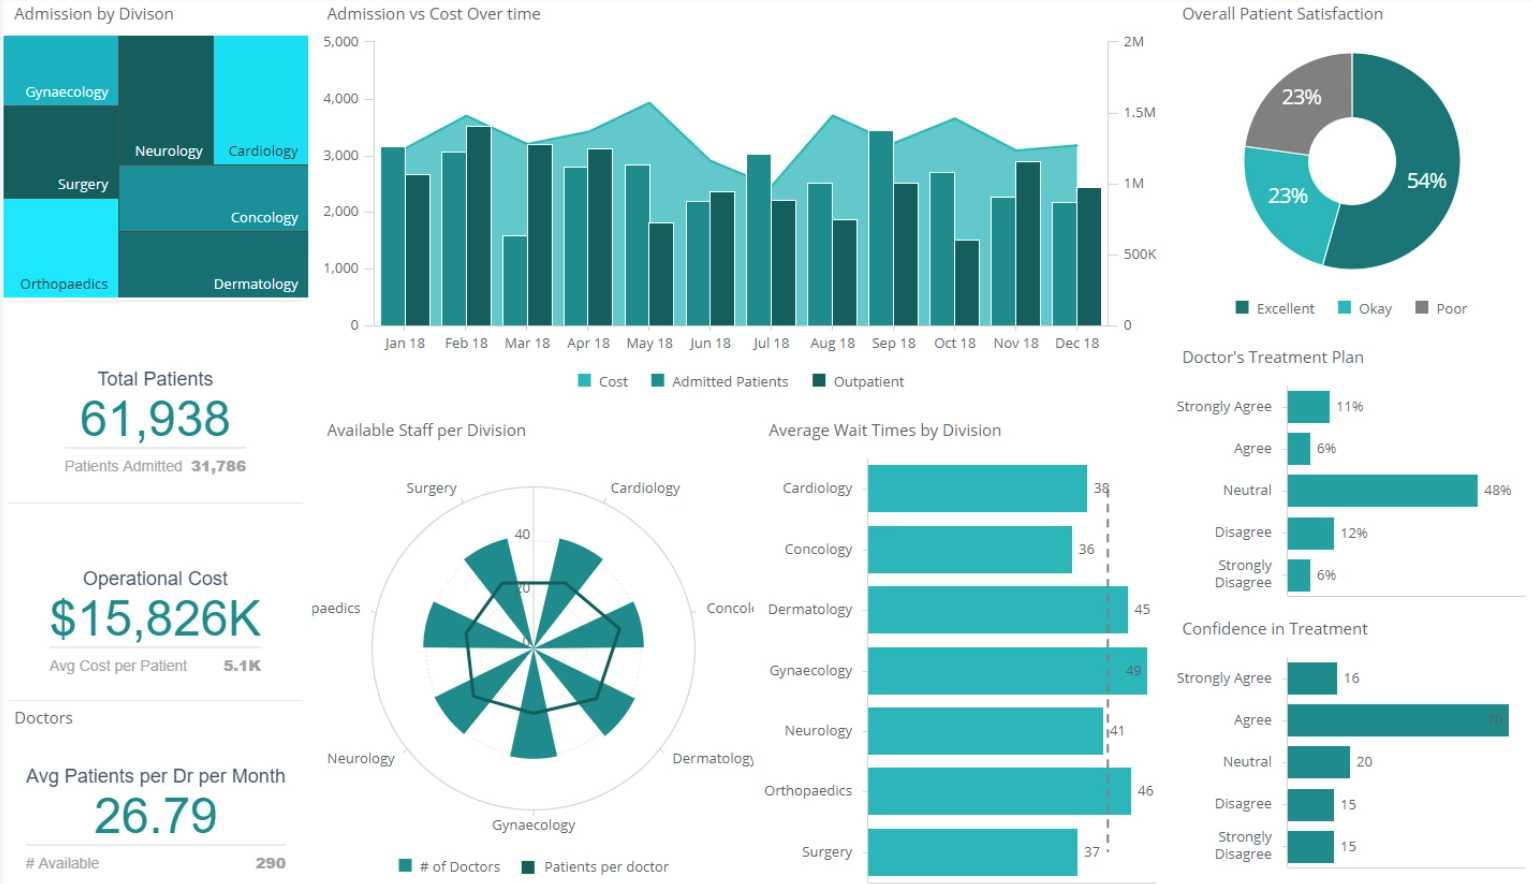
Hospital Performance Dashboards. Sisense
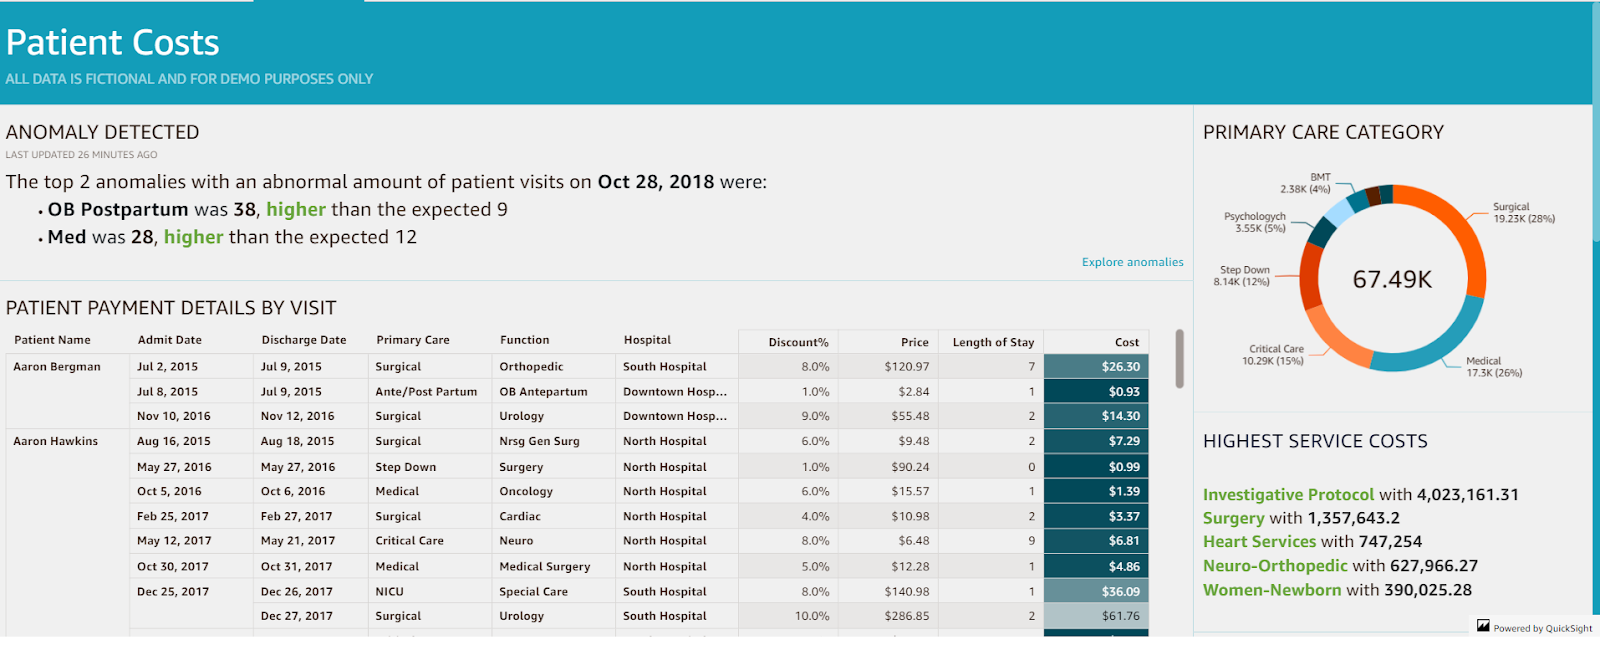
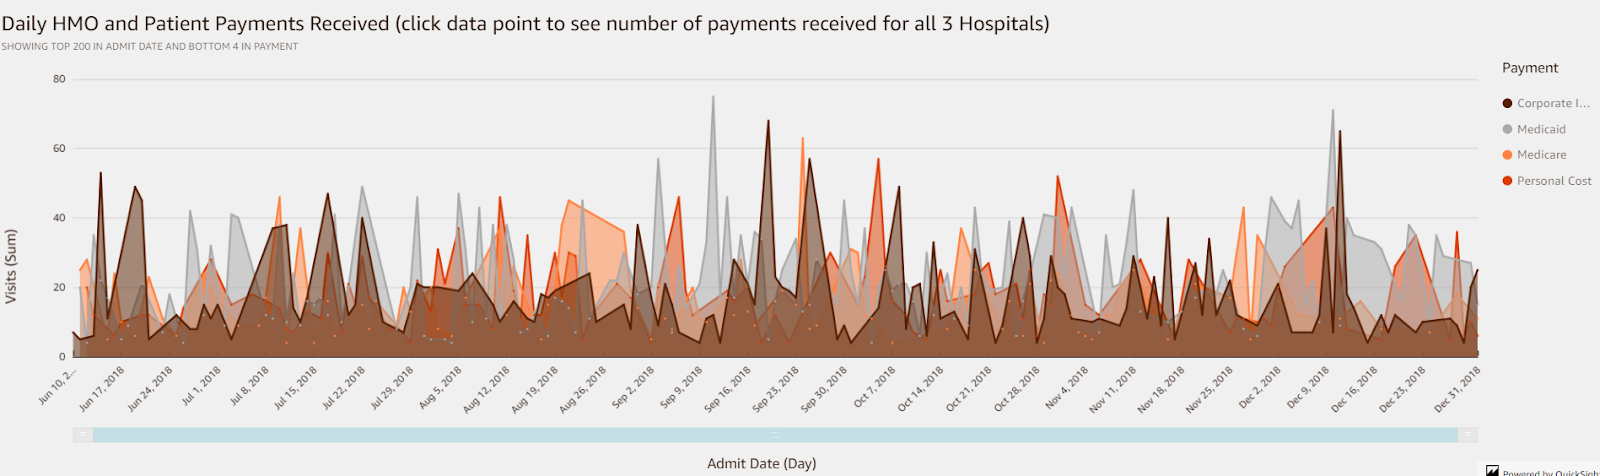
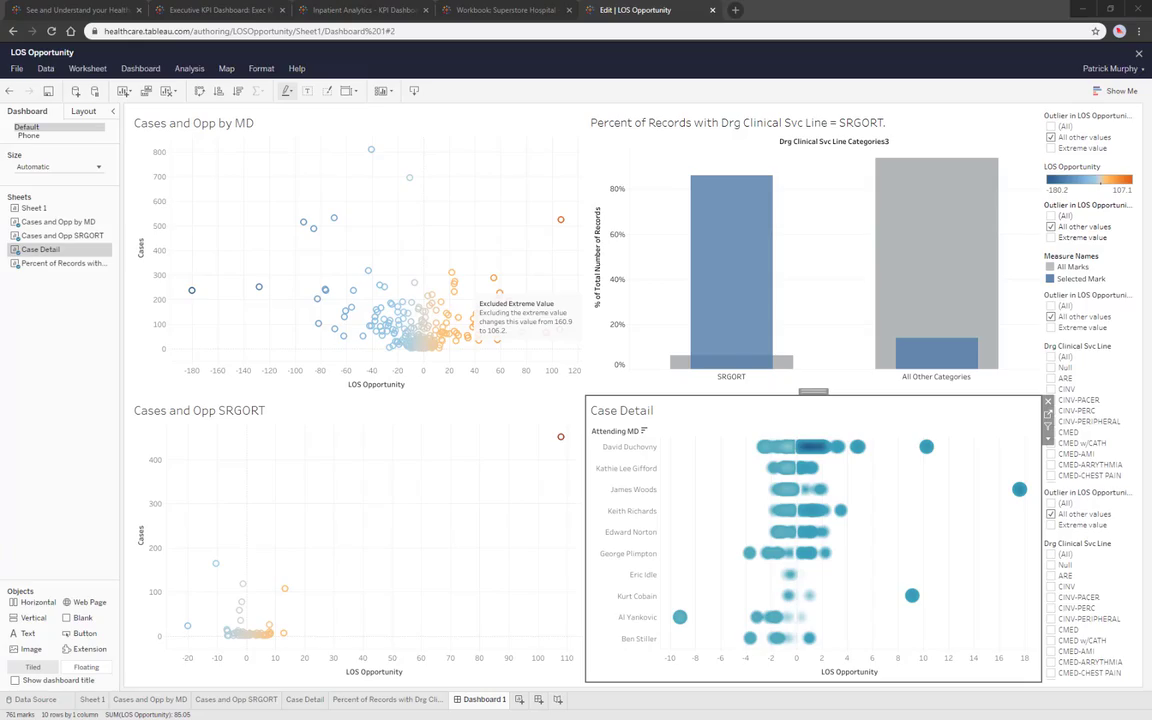
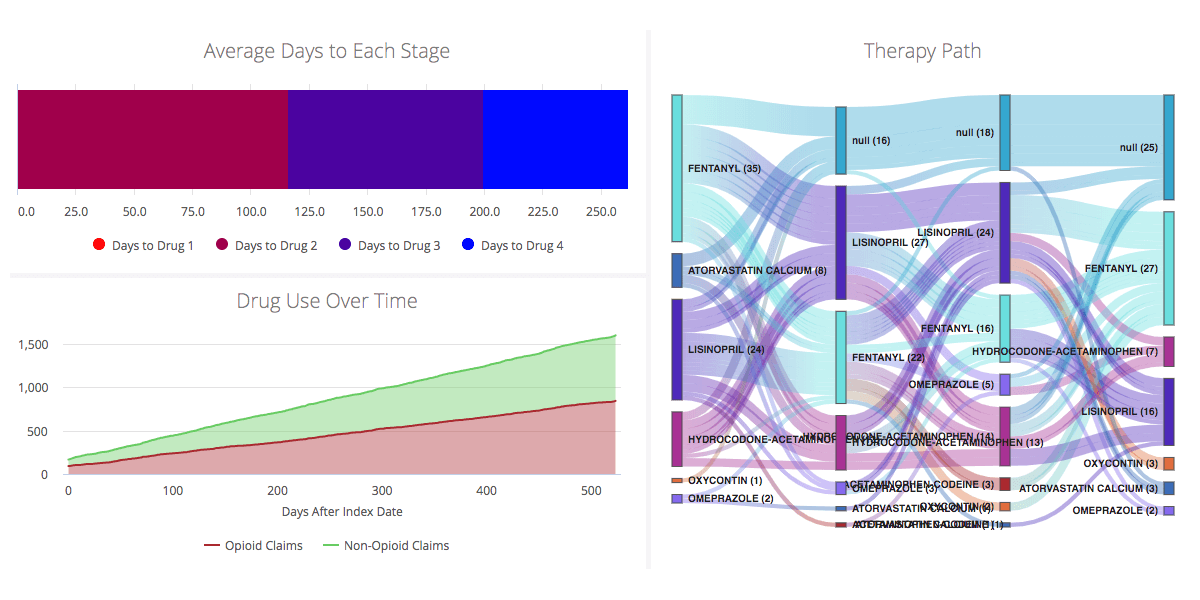
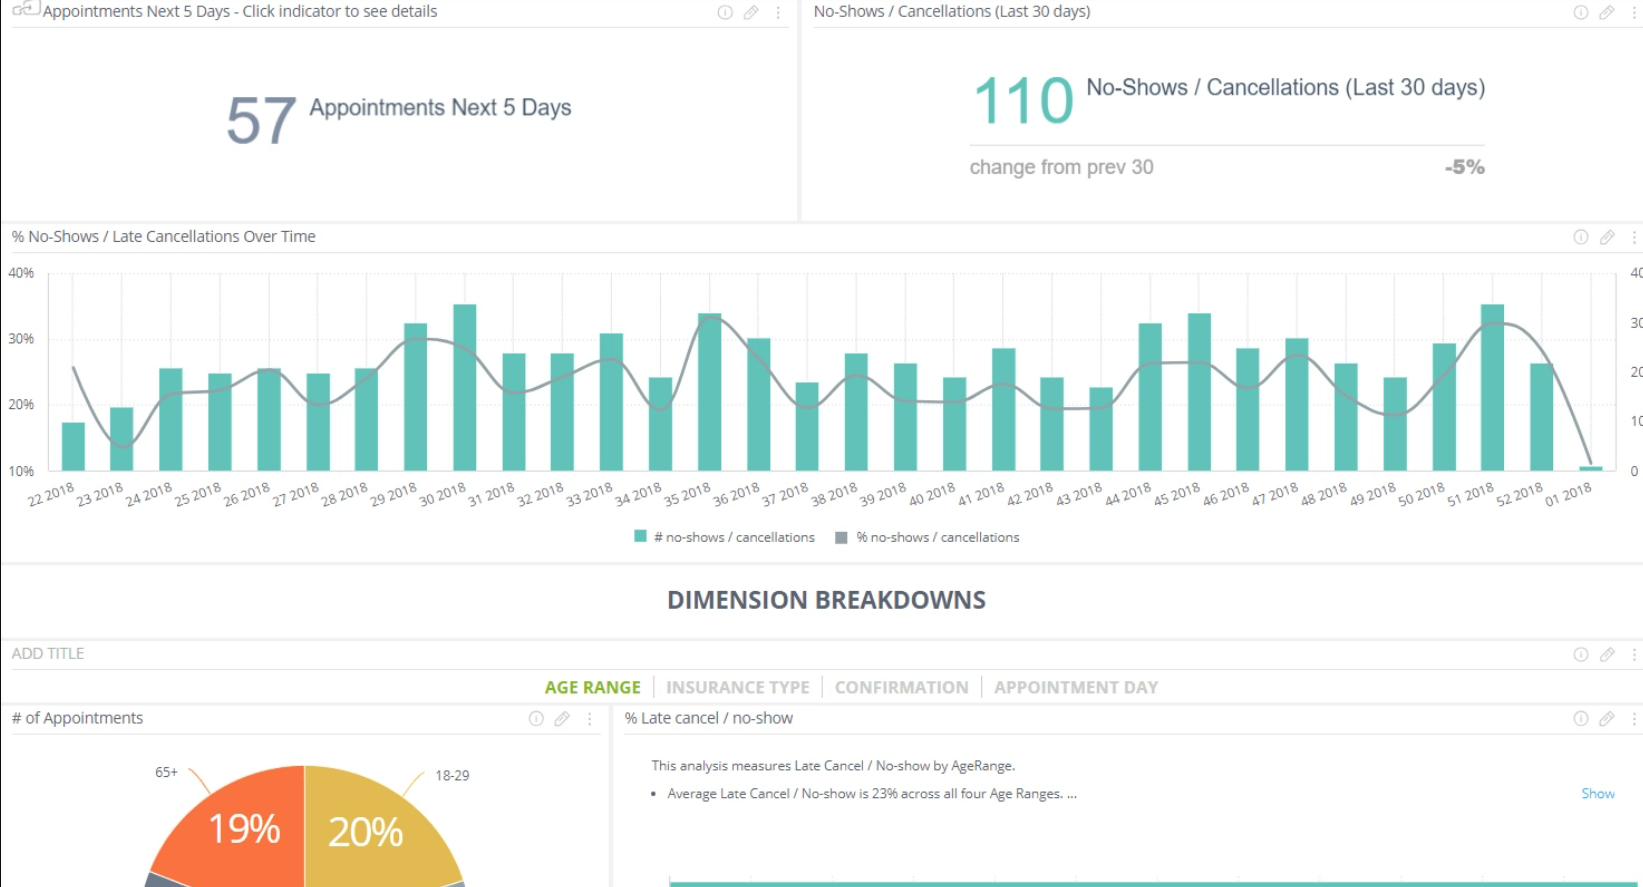
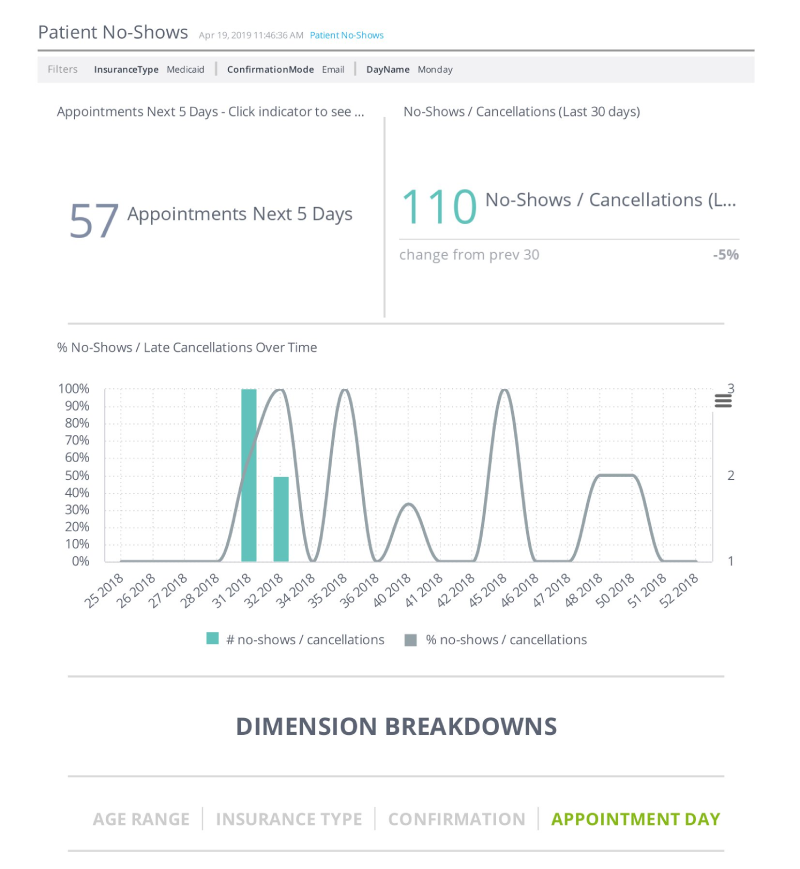
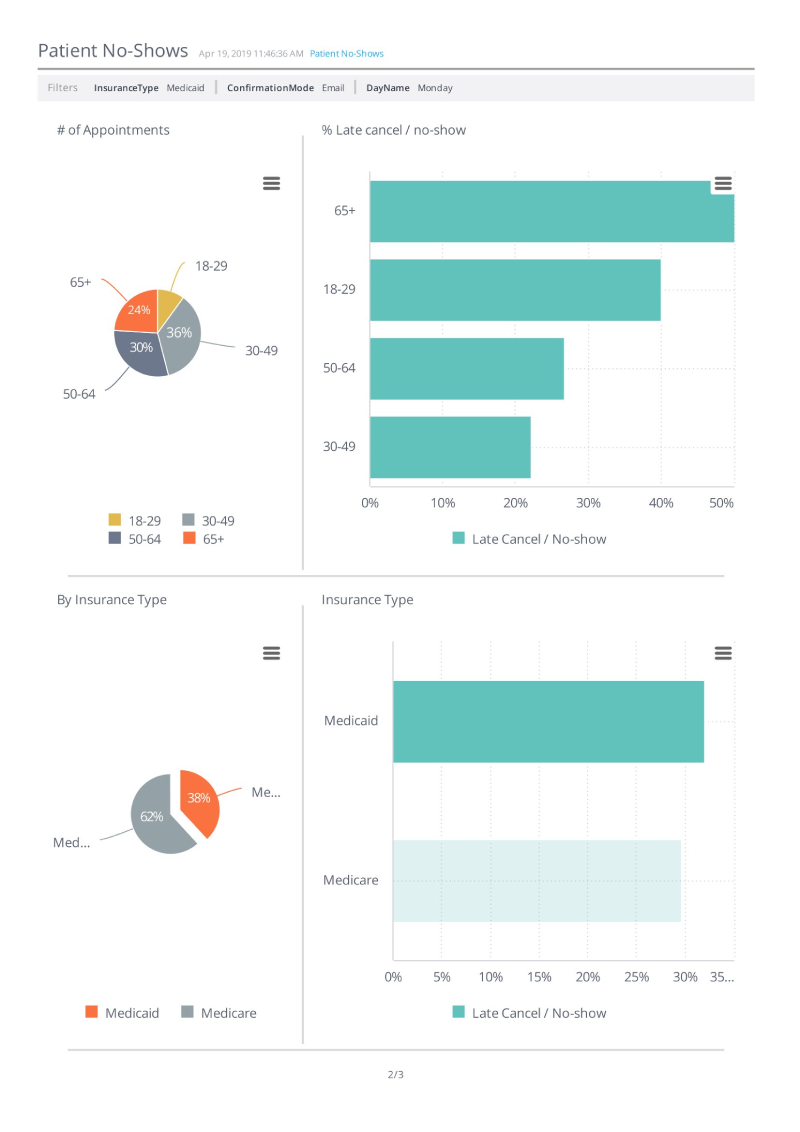
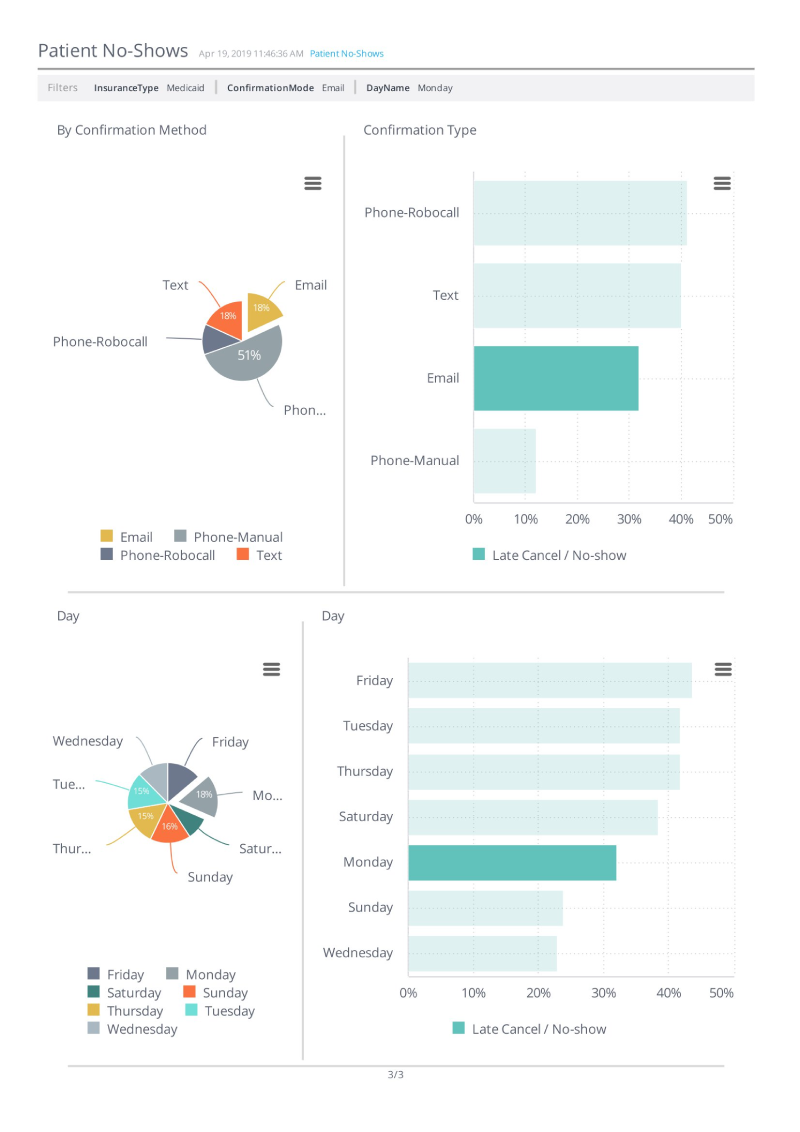
Dashboards for Patient No-Show Data Analysis and Prediction
One common issue in outpatient practices is patient no-shows and late cancellations, which lead to decreased revenue for the practice, and longer wait times for other patients.
Our aim is to increase patient attendance and reduce last-minute cancellations, to make more patients being seen by healthcare providers.
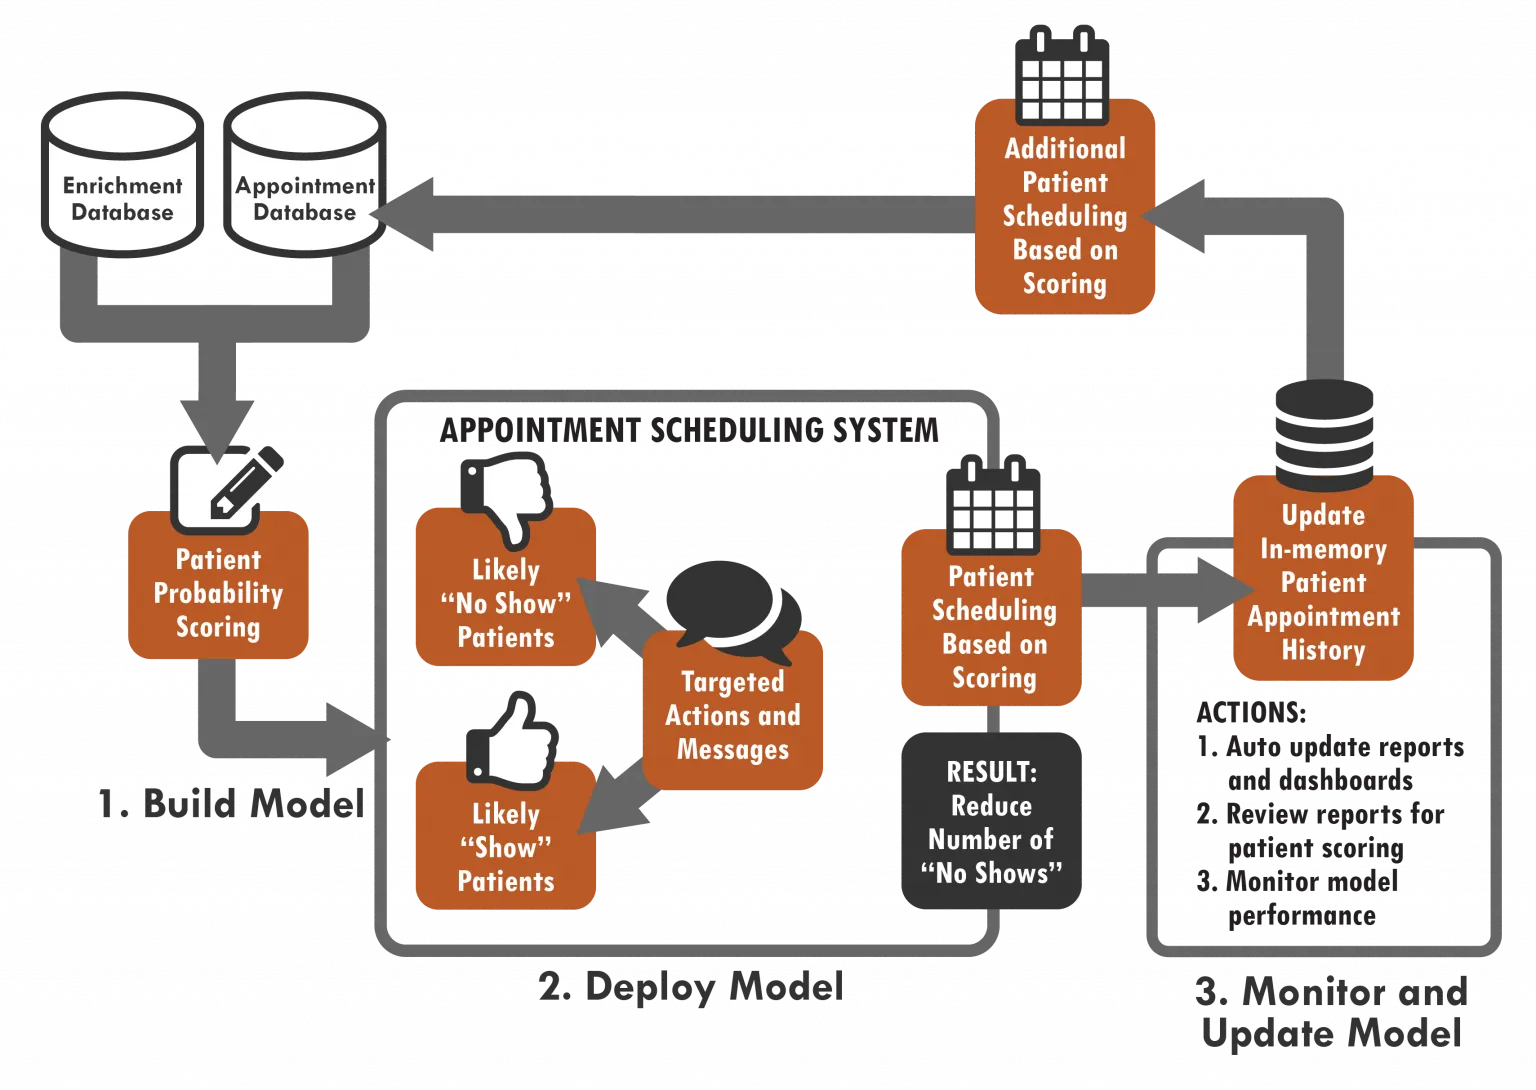
We could use analytics to predict when patients may not show up or cancel at the last minute, allowing us to take a proactive approach to reduce these occurrences.
To achieve this goal, we need to identify the breakdown of appointments by various patient characteristics, and then predict which patients are more likely to cancel, and schedule appointments accordingly. As a simple prevention measure, we can also implement tailored appointment reminders. Additionally, using run charts can provide valuable information about attendance trends and fluctuations over time, helping to further refine our predictive models and intervention strategies.
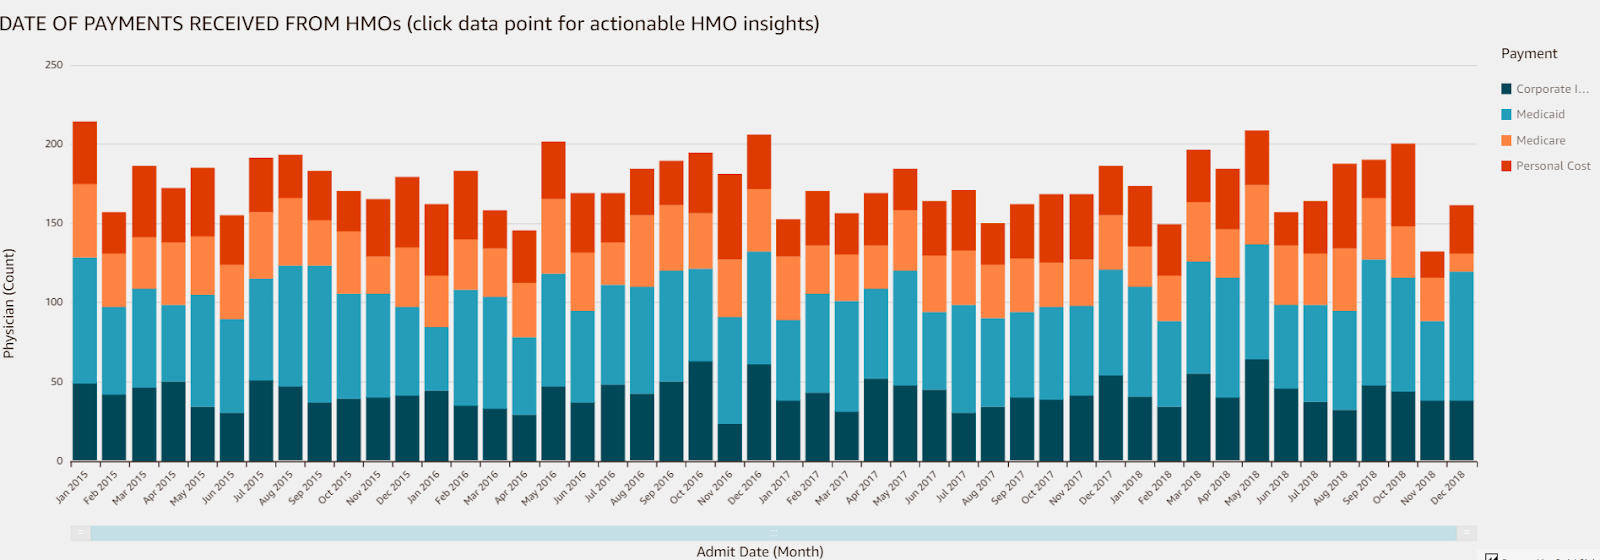
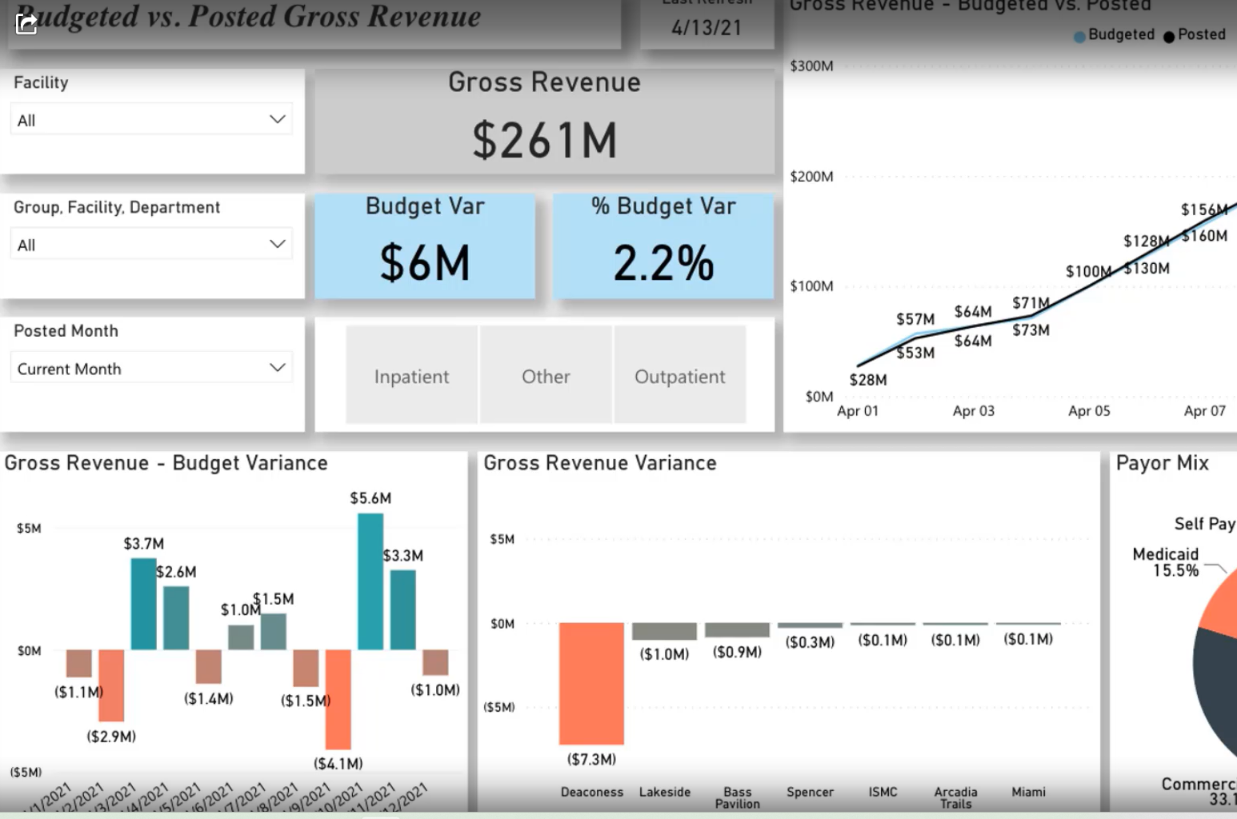
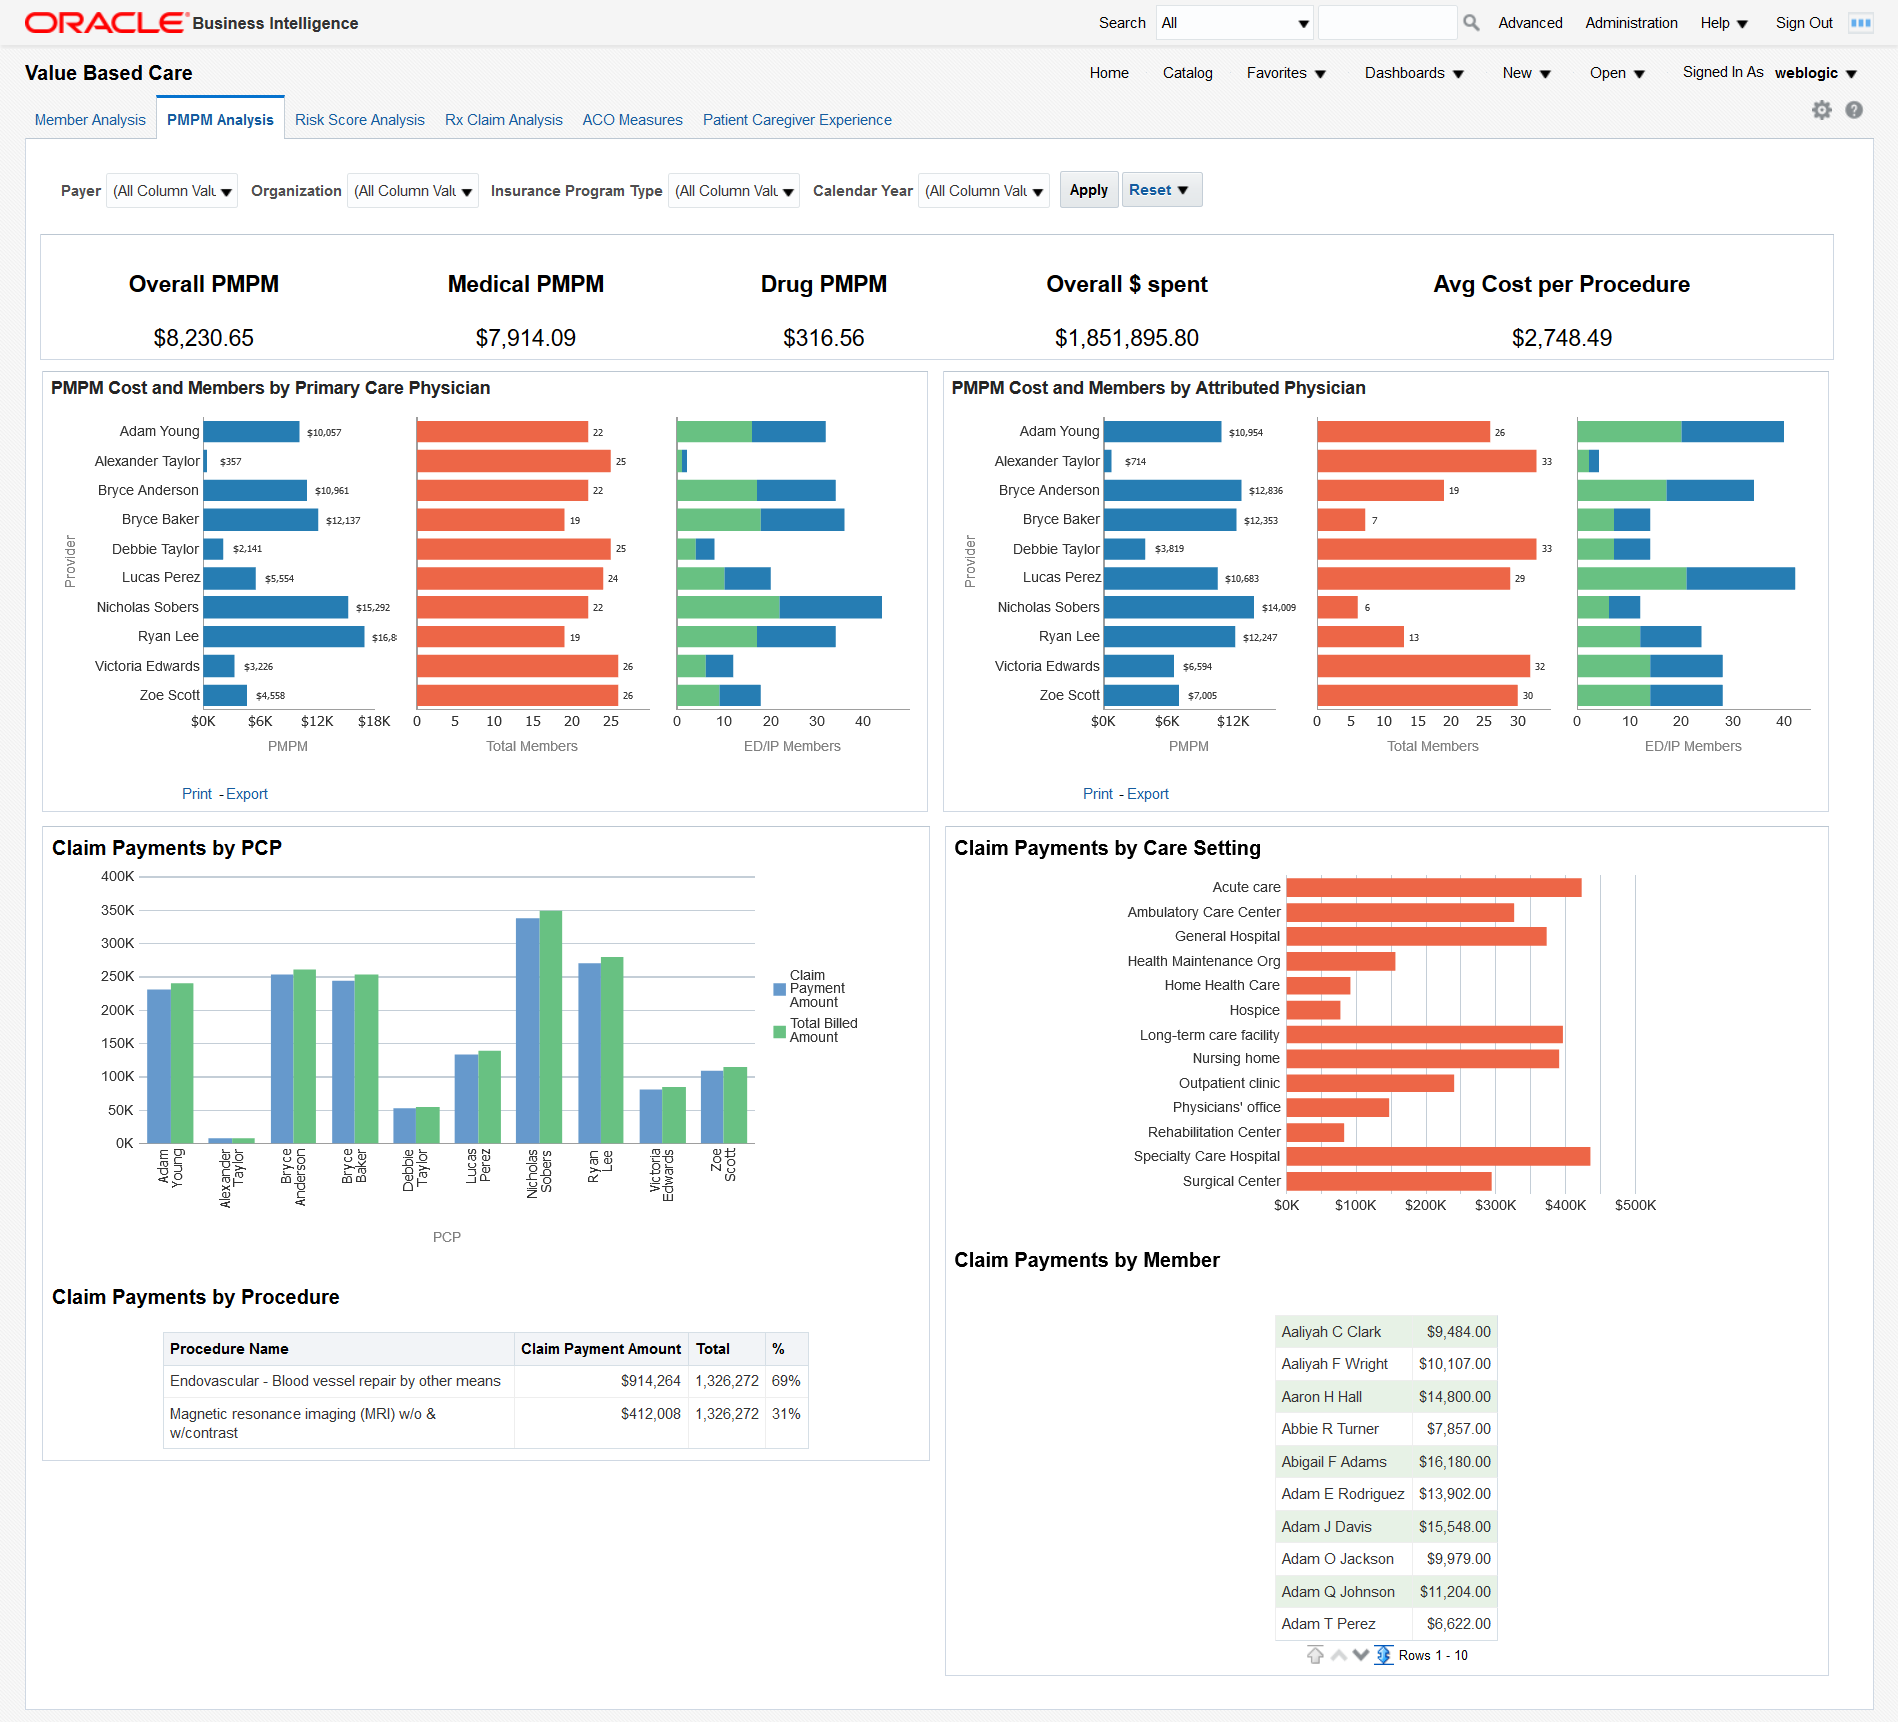
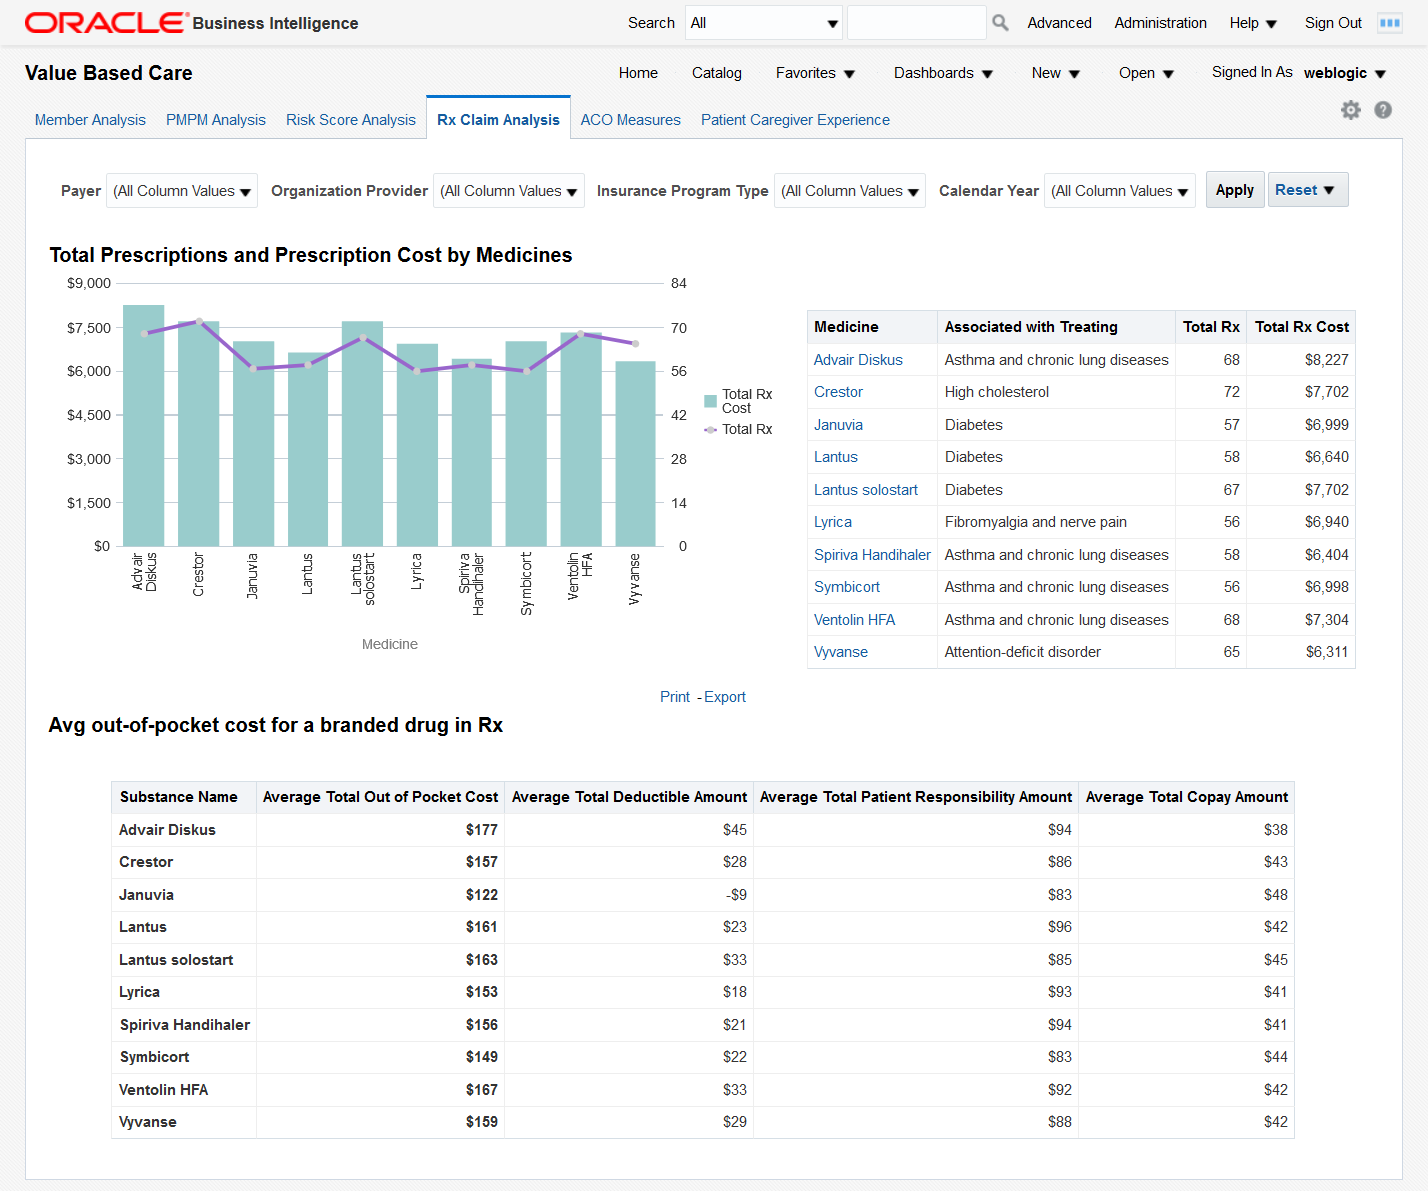
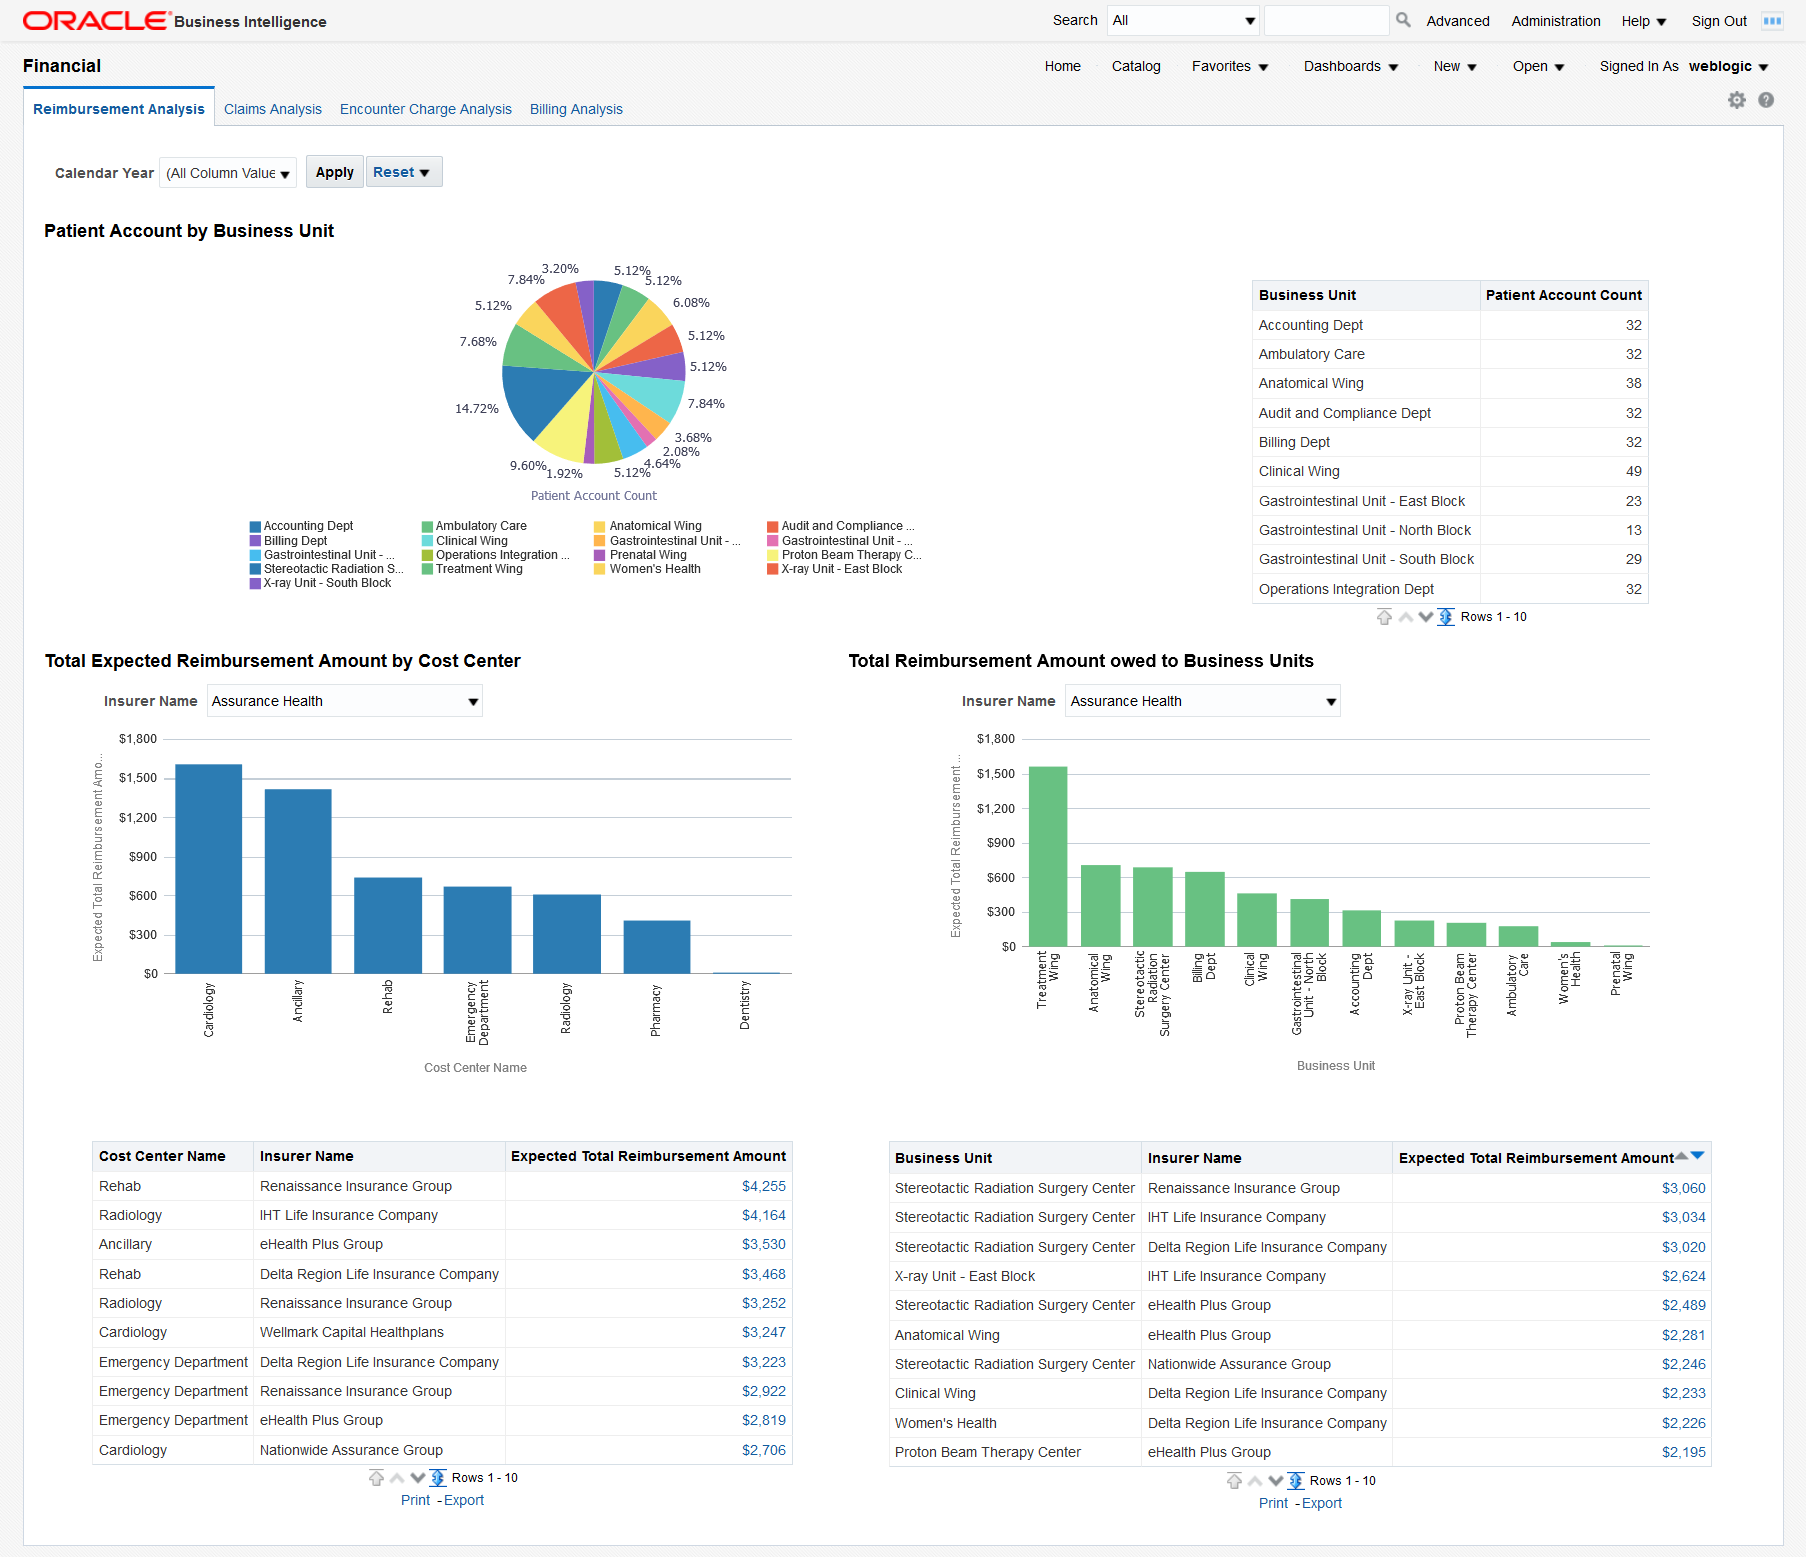
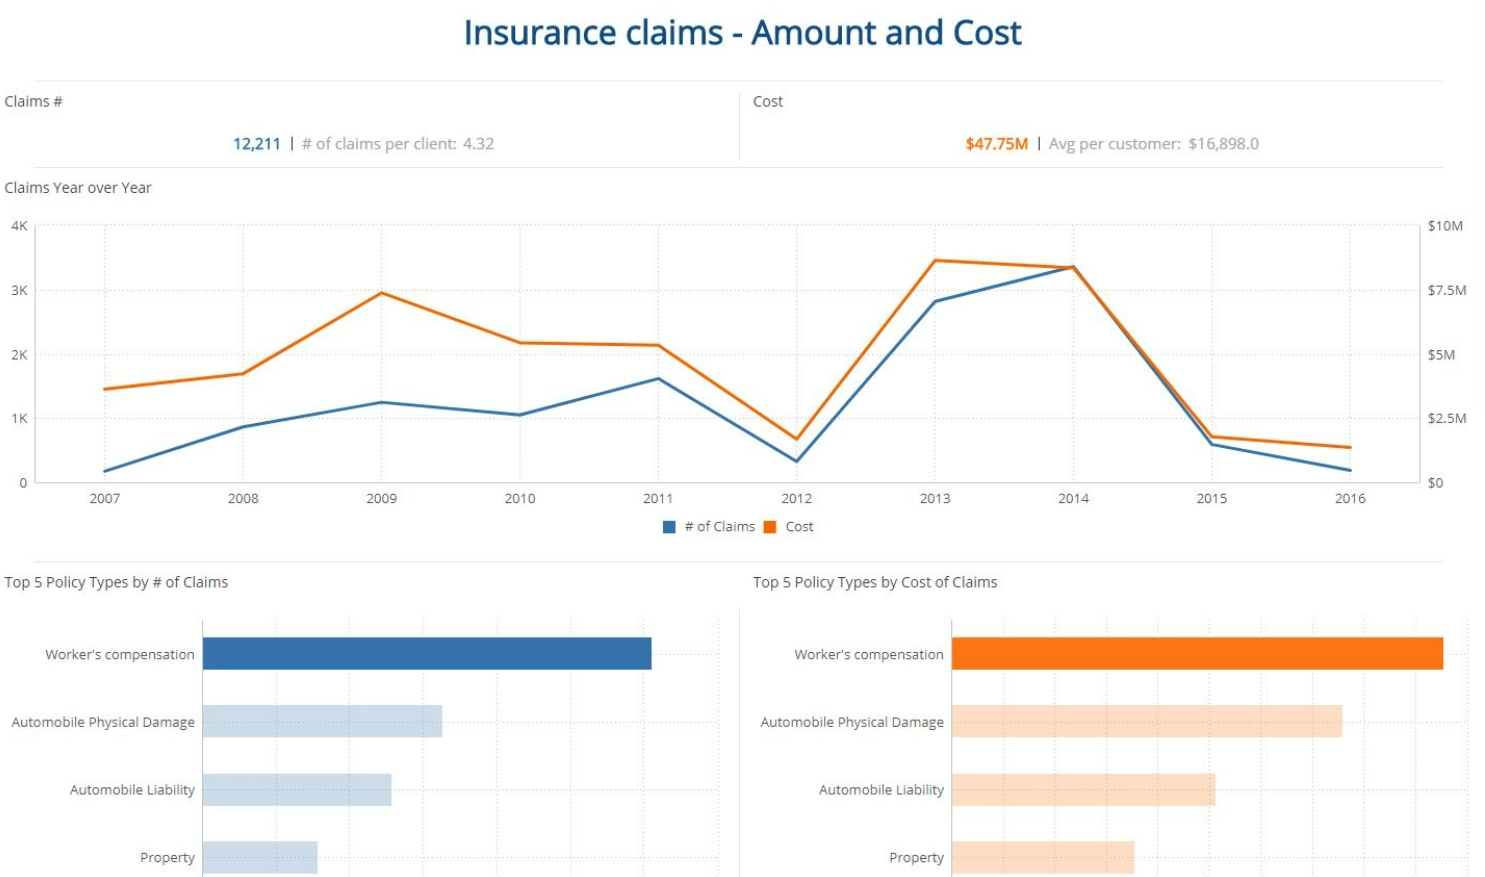
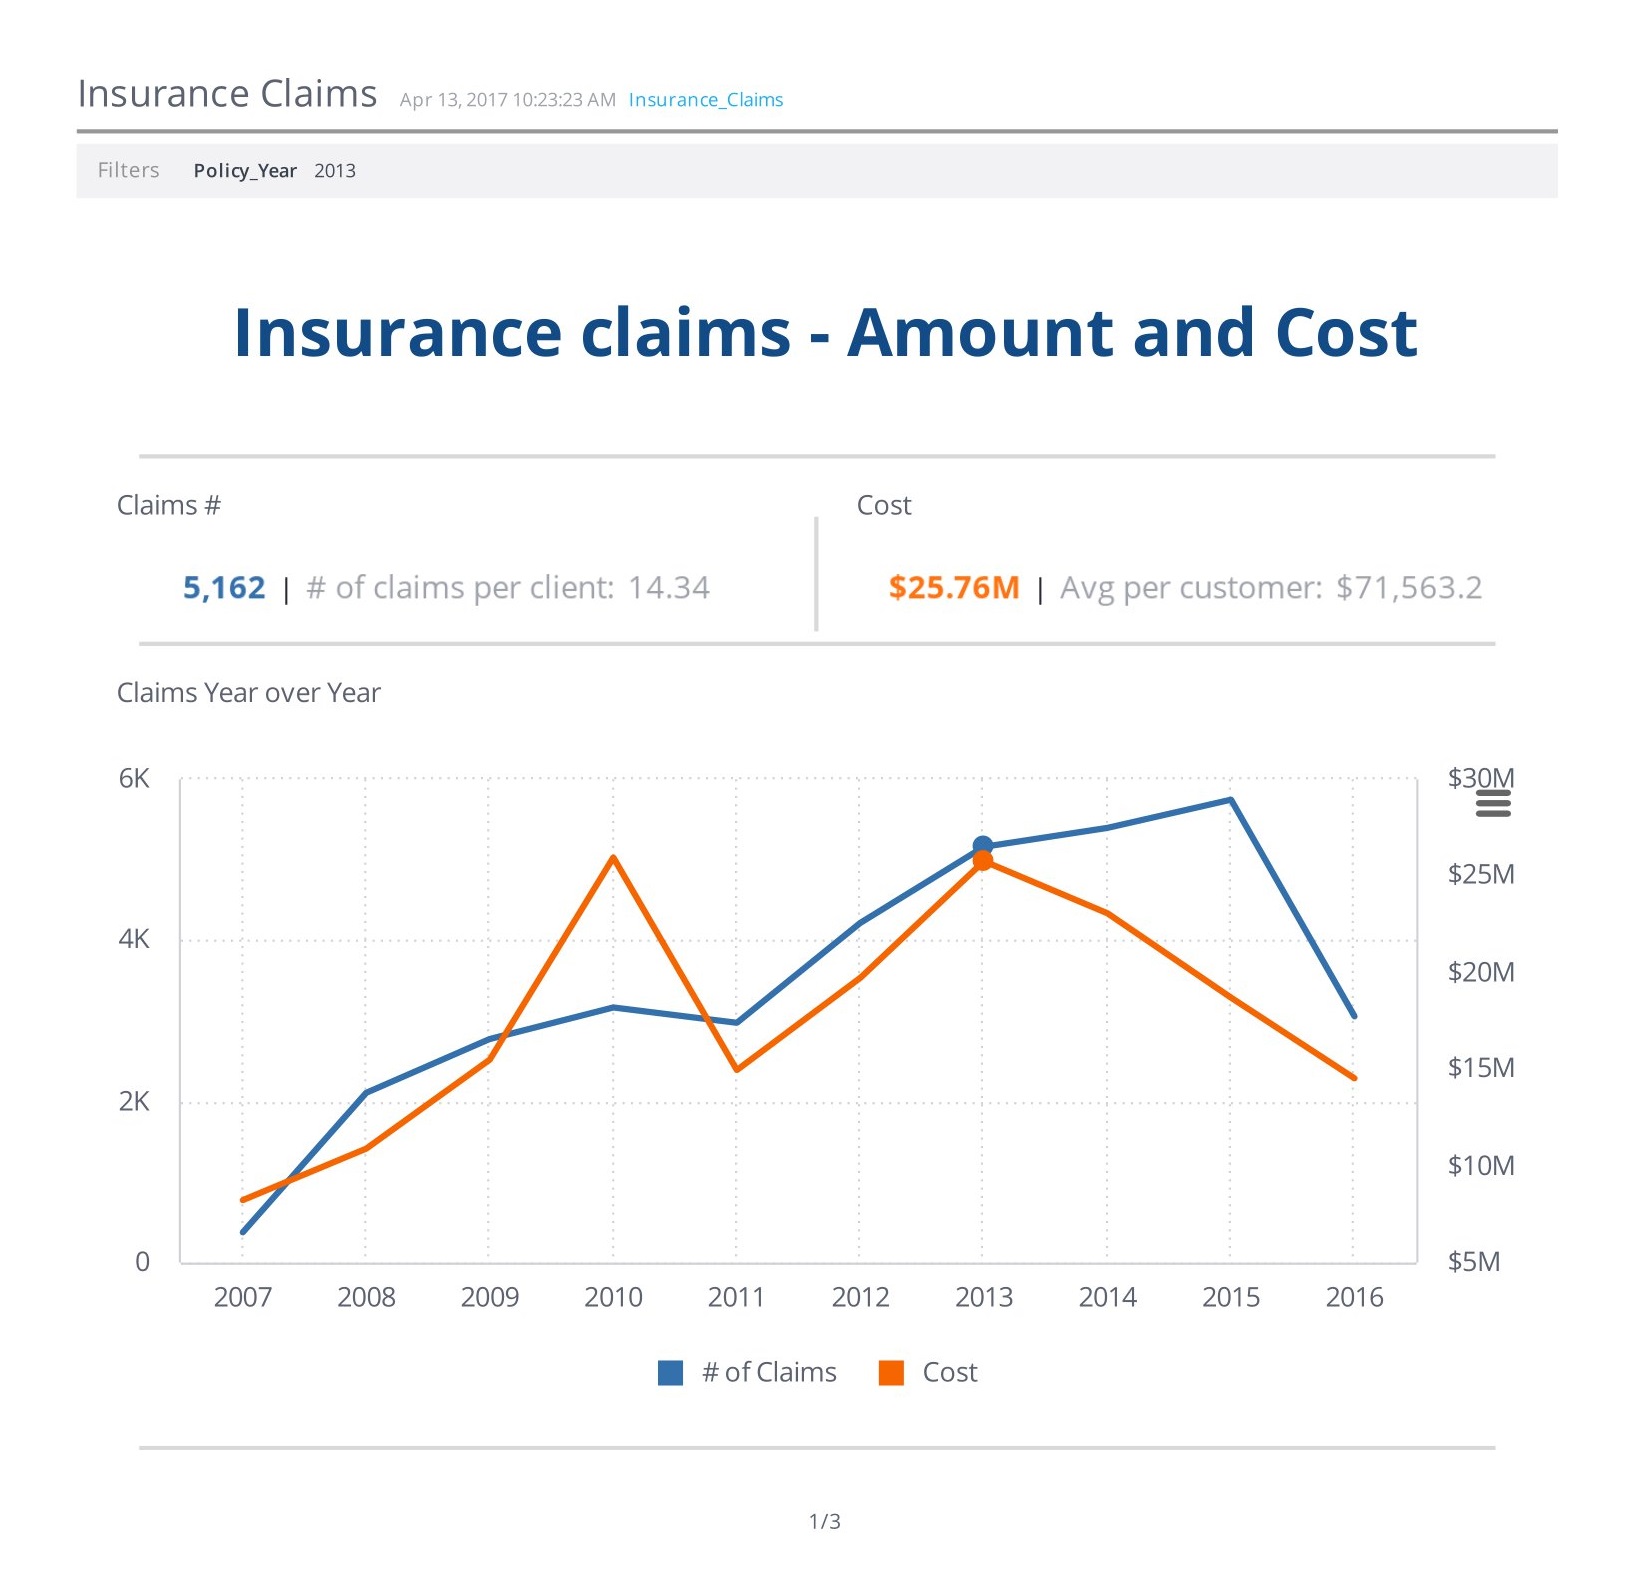
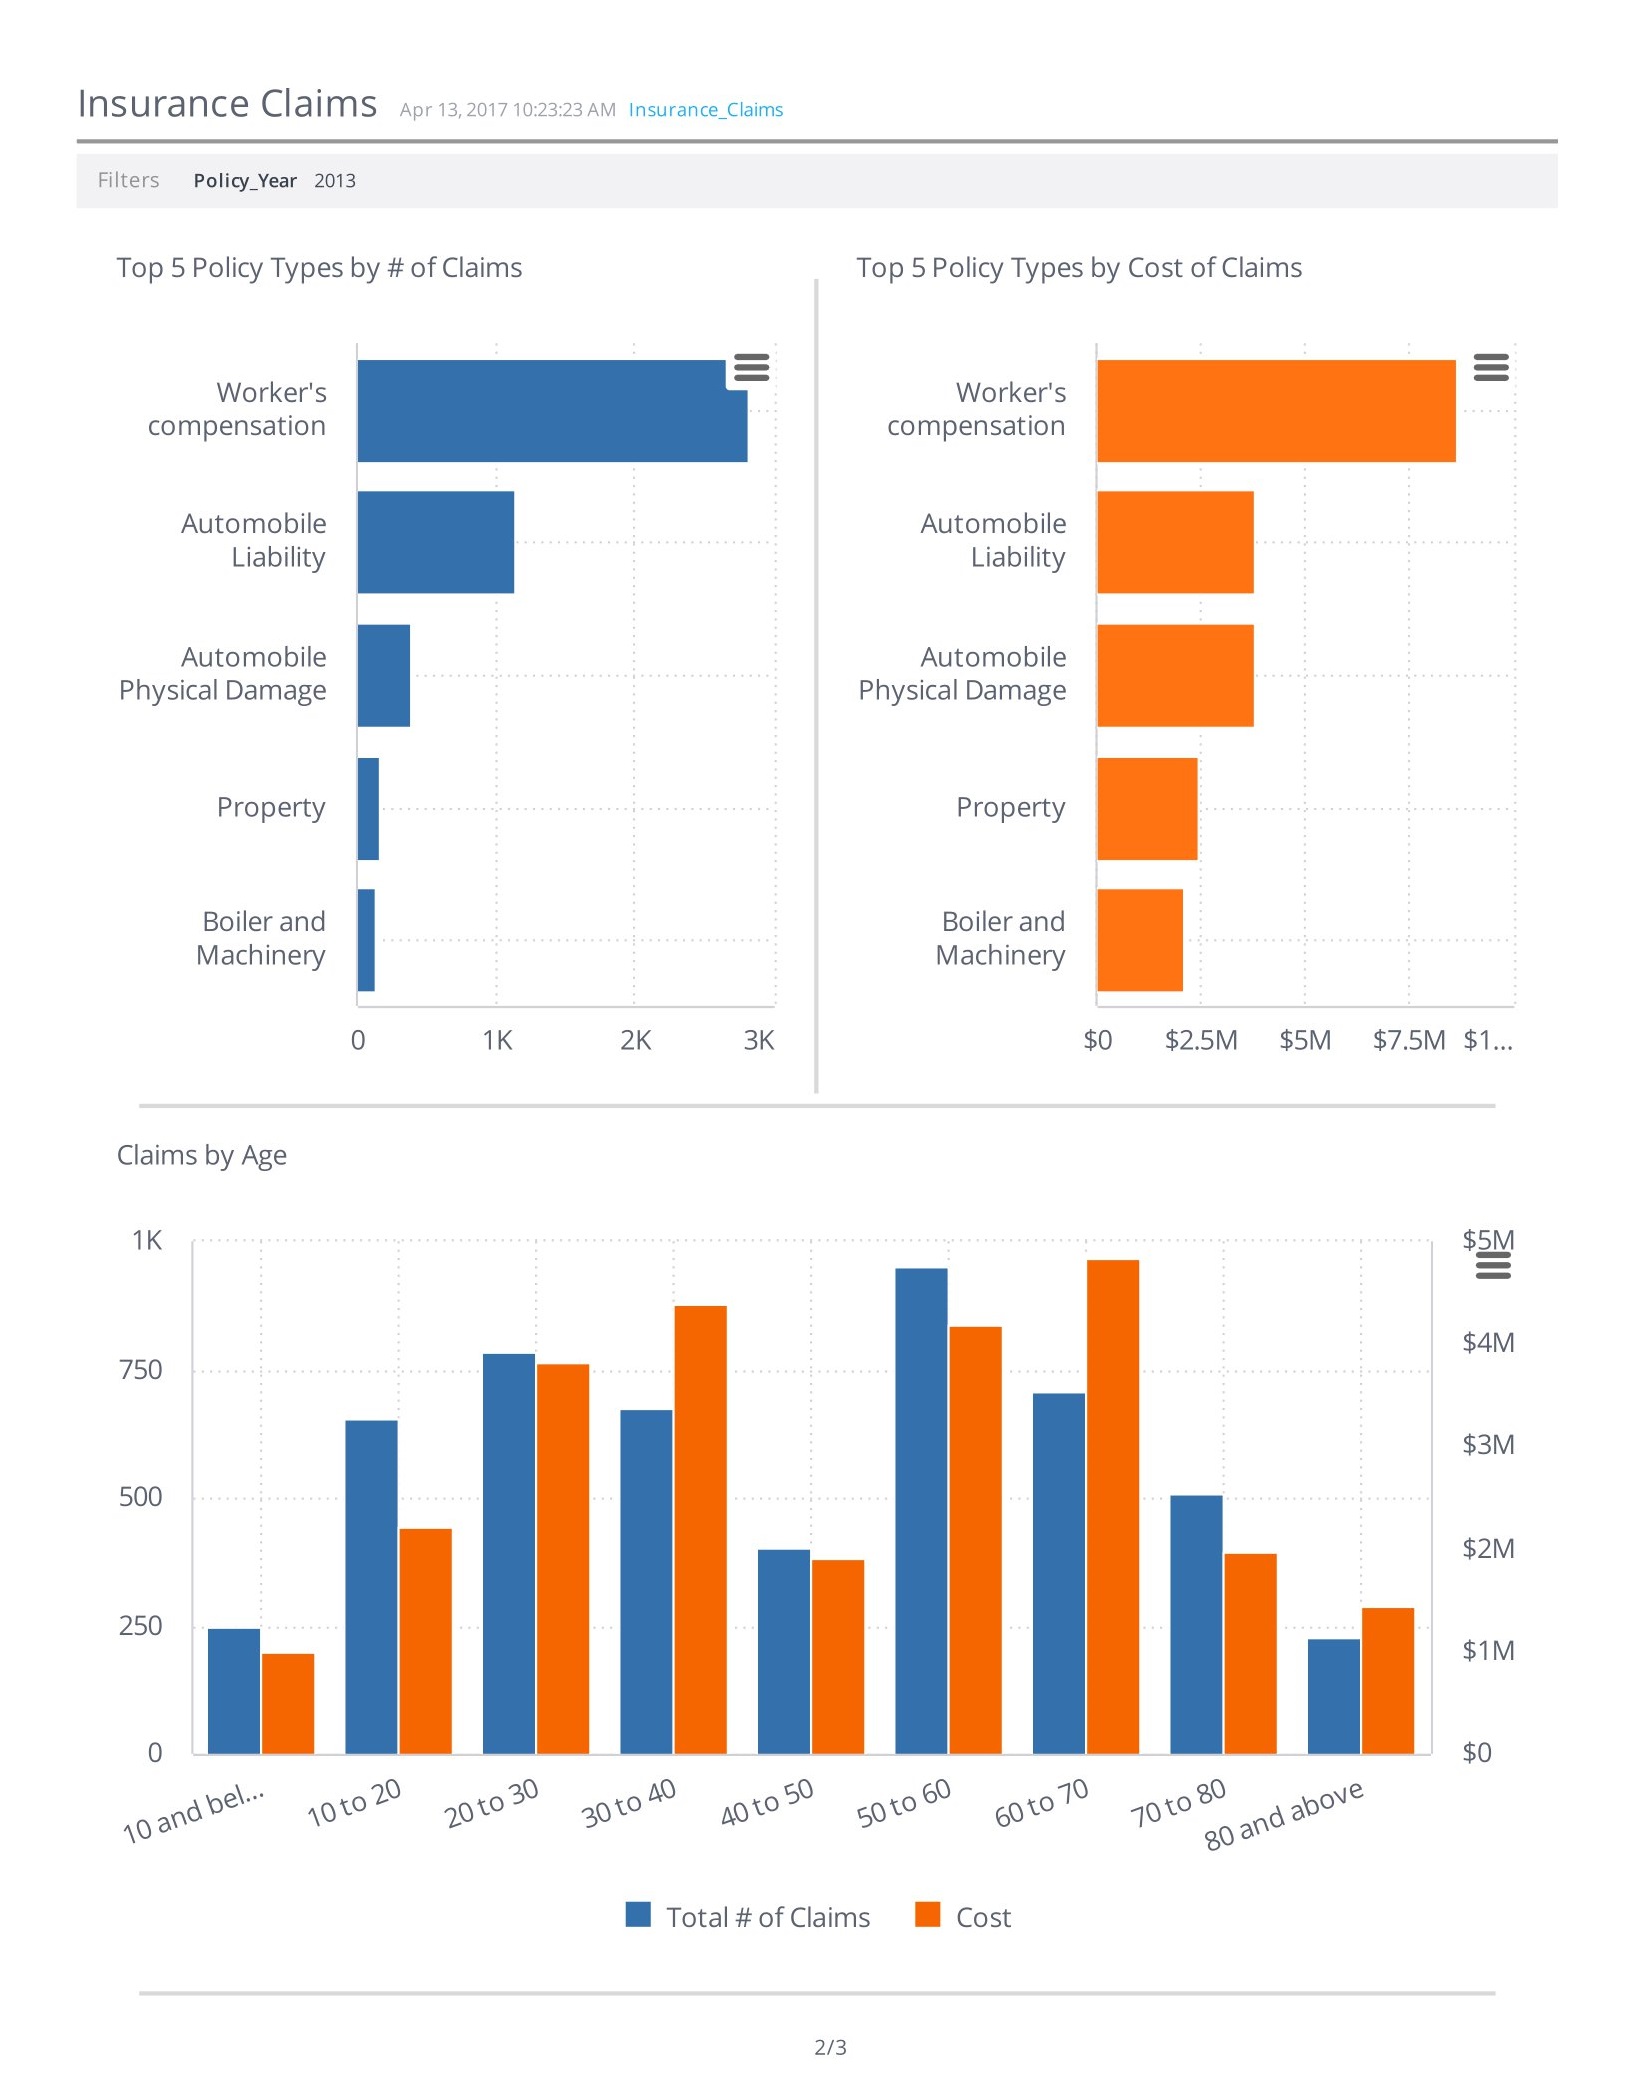
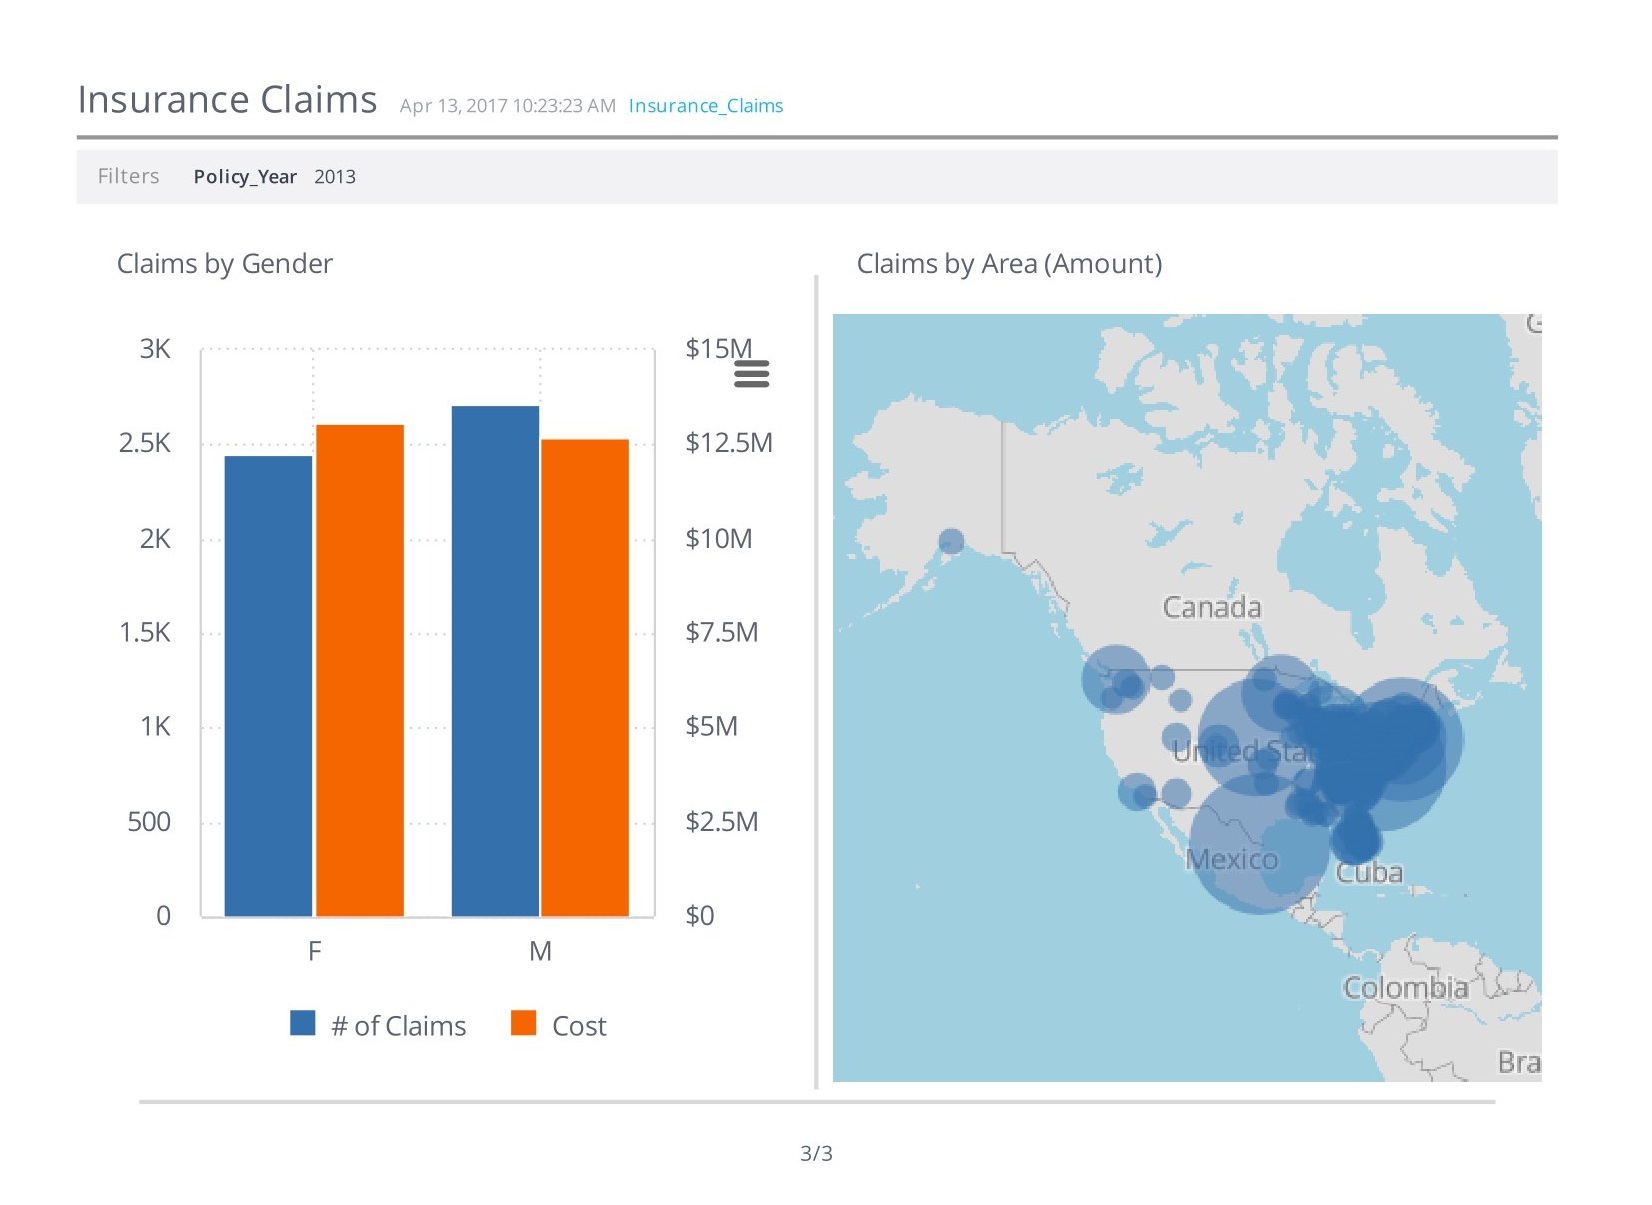
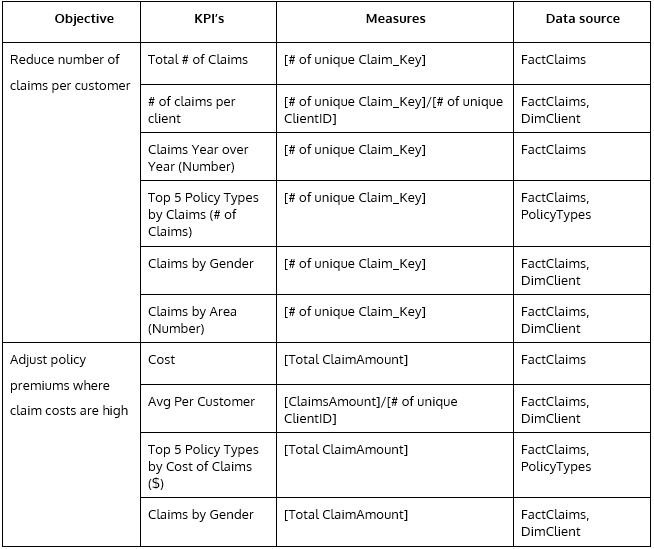
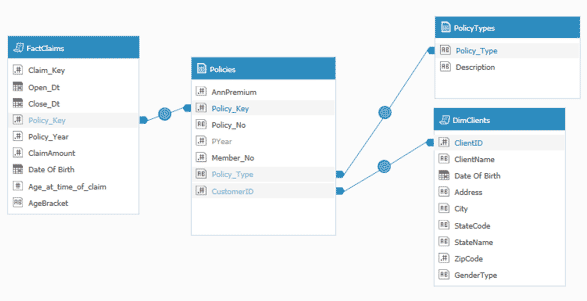
Insurance Claims Dashboards
To maintain profitability, insurance companies must continuously monitor the claims made under their various policies. This allows them to modify premiums for policies with chief claims ratios or introduce new policies to reduce premiums for their clients.
Additionally, identifying the number of claims per customer or policy can help insurers offer cost-effective premiums that benefit both the customers and the company.
The insurance analytics dashboard plays a critical role in achieving these objectives.

Rate this article
Recommended posts
.jpg)
.jpg)
.jpg)
.jpg)
.jpg)
.jpg)
.jpg)
.jpg)
.jpg)
.jpg)
.jpg)
.jpg)
.jpg)
.jpg)
.jpg)
.jpg)
.jpg)
.jpg)
.jpg)
.jpg)
.jpg)
.jpg)
.jpg)
.jpg)
.jpg)
.jpg)
.jpg)
.jpg)
.jpg)
.jpg)
.jpg)
.jpg)
.jpg)
.jpg)
.jpg)
.jpg)
.jpg)
.jpg)
.jpg)
.jpg)
.png)
.jpg)
.jpg)
.jpg)
.jpg)
.jpg)
.jpg)
.jpg)
.jpg)
.jpg)
.jpg)
.jpg)
.jpg)
.jpg)
.jpg)
.jpg)
.jpg)
.jpg)
.jpg)
.jpg)
.png)
.jpg)
.jpg)
Portfolio

Our Clients' Feedback


Belitsoft has been the driving force behind several of our software development projects within the last few years. This company demonstrates high professionalism in their work approach. They have continuously proved to be ready to go the extra mile. We are very happy with Belitsoft, and in a position to strongly recommend them for software development and support as a most reliable and fully transparent partner focused on long term business relationships.

Global Head of Commercial Development L&D at Technicolor
They use their knowledge and skills to program the product, and then completed a series of quality assurance tests. We were working in an agile way with them. Belitsoft performed very well throughout our project. We are definitely looking at Belitsoft as a long-term partner.

Service Delivery Director at Crimson (United Kingdom)
I highly recommend Belitsoft for website design and development. We were up against a tight deadline to launch the project. The work was delivered on time and within budget! I will continue working with Belitsoft as a valued partner for our web development!

Program Administrator at UC Berkeley (United States)
We have worked with Belitsoft team over the past few years on projects involving much customized programming work. They are knowledgeable and are able to complete tasks on schedule, meeting our technical requirements. We would recommend them to anyone who is in need of custom programming work.

Main Partner at Hathway Tech (United States)
Belitsoft company is able to make changes instantly. One of our internal engineers has commented about how clean their code is. Belitsoft seems to know what they're doing, which I appreciate.

Co-Founder at HOWCAST MEDIA (United States)
It was a great pleasure working with Belitsoft software development company. New requirements and adjustments were implemented fast and precisely. We can recommend Belitsoft and are looking forward to start a follow-up project.

Head of Division at Fraunhofer FIT (Germany)
Belitsoft company has been able to provide senior developers with the skills to support back end, native mobile and web applications. We continue today to augment our existing staff with great developers from Belitsoft.

CEO at Apollo Matrix (United States)
Belitsoft company delivered dedicated development team for our products, and technical specialists for our clients' custom development needs. We highly recommend to use this company if you want the same benefits.

Managing Director at Key2Know A/S in 2012 (Denmark)
We approached BelITsoft with a concept, and they were able to convert it into a multi-platform software solution. Their team members are skilled, agile and attached to their work, all of which paid dividends as our software grew in complexity.

COO at Regenerative Medicine LLC (United States)
Having worked with Belitsoft as a service provider, I must say that I'm very pleased with the company's policy. Belitsoft guarantees first-class service through efficient management, great expertise, and a systematic approach to business. I would strongly recommend Belitsoft's services to anyone wanting to get the right IT products in the right place at the right time.

CEO at Moblers
If you are looking for a true partnership Belitsoft company might be the best choice for you. They have proven to be most reliable, polite and professional. The team managed to adapt to changing requirements and to provide me with best solutions. I strongly recommend Belisoft.

Director at ShowCast Limited (Germany)
I expected and demanded a lot of you at Belitsoft company, but you exceeded my expectations. You acted pro-actively, challenged me at the right moments. Thanks!"

CEO at Ticken B.V. (Netherlands)


We have been working for over 10 years and they have become our long-term technology partner. Any software development, programming, or design needs we have had, Belitsoft company has always been able to handle this for us.
Founder from ZensAI (Microsoft)/ formerly Elearningforce